
Translate this page into:
Avascular necrosis of femoral head and its mimics: A comprehensive review

*Corresponding author: Raghu Teja Sadineni, Department of Diagnostic and Interventional Radiology, Pramodini Imaging and Diagnostics, Vijayawada, Andhra Pradesh, India. sadineniraghu@gmail.com
-
Received: ,
Accepted: ,
How to cite this article: Velicheti S, Sadineni R, Dubey A. Avascular necrosis of femoral head and its mimics: A comprehensive review. Indian J Musculoskelet Radiol. 2025;7:77-93. doi: 10.25259/IJMSR_58_2024
Abstract
This article provides a comprehensive overview of avascular necrosis (AVN) of the femoral head. It emphasizes the importance of imaging in early diagnosis, as the initial stages are often asymptomatic, with pain typically developing later. Femoral head is the most common site to be involved due to a combination of precarious arterial supply and high weight loading in standing positions. This article focuses on the practical points that need to be included in the report, identifying potential causes, and utilizing established classifications to standardize reporting and facilitate communication among clinicians. This helps in understanding how radiological findings correlate with clinical symptoms, to plan potential treatment strategies, for assessing the prognostic factors and monitoring disease progression or treatment response through follow-up imaging. In addition, the article briefly touches on other hip conditions that may mimic the radiological appearance of AVN, enhancing differential diagnosis. This update aims to clarify ambiguous aspects of the topic, providing valuable insights for clinicians and radiologists alike.
Keywords
Avascular necrosis mimics
Bone death
Crescent sign
Double line sign
Post decompression
Stress fracture

INTRODUCTION
Osteonecrosis, or ischemic bone death, results from the loss of blood supply to bone tissue, leading to cell death and structural collapse. This term encompasses both avascular necrosis (AVN) and bone infarcts, with specific definitions for different regions of bone involvement. AVN typically affects subchondral or epiphyseal areas, while bone infarcts are more commonly seen in the medullary or metaphyseal regions. The significance of AVN lies in its potential to progress to articular collapse, transforming a localized osseous issue into a broader osteoarticular problem that can compromise joint function. Moreover, there is a notable risk of bilateral involvement, with about 50% of patients developing issues in the opposite hip within 2 years. Multifocal osteonecrosis, characterized by involvement of three or more joints, often suggests a systemic etiology, potentially linked to factors such as autoimmune conditions or metabolic disorders. The recent increase in osteonecrosis cases in the Indian subcontinent following the COVID-19 pandemic due to steroid usage underscores the need for vigilance and early detection.[1] We intend to highlight the multimodality imaging findings of osteonecrosis of femoral head (ONFH) which is essential for accurate diagnosis and management.
DISCUSSION
Pathophysiology
The majority of the blood supply to the femoral head is derived from the extracapsular arterial ring formed by the medial and lateral femoral circumflex arteries, which arise from the deep femoral artery. Osteonecrosis can result from two primary mechanisms of blood supply loss: [Table 1]
| Causes of AVN | Pathophysiology | Imaging clues |
|---|---|---|
| Trauma | Retinacular vessel injury | Fracture at neck of femur |
| Sickle-cell disease Dysbaric ischemia Thrombocytopenia Fat embolism |
Arteriolar occlusion | H-shaped vertebrae and splenic involvement in sickle cell disease Marrow abnormalities in Thrombocytopenia Fractures in fat embolism |
| Gaucher’s disease Tuberculosis Corticosteroids/alcohol |
Sinusoidal compression | Abdominal visceral involvement, Erlenmeyer flask deformities in Gauchers Lymphadenopathy in TB Signs of alcoholic liver disease |
| Steroid-induced AVN | Fat hypertrophy leading to sinusoidal compression, fat emboli and intravascular coagulation | Bilateral femoral head involvement, multiple bones AVN and medullary infarcts |
| Systemic lupus erythematosus | Vasculitis+steroids | Infarcts at multiple bones and at unusual sites |
| Leukemia | Intravascular clotting, increased marrow pressure, toxic effects of chemotherapy | Marrow infiltration, multiple bones, and sites involvement. |
AVN: Avascular necrosis, TB: Tuberculosis
Direct Vascular Involvement: Conditions such as thrombosis, occlusion, or vasculitis can directly damage the blood vessels supplying the bone, leading to ischemic changes. This disruption of blood flow can be acute or chronic, depending on the underlying cause.
Increased Intramedullary Pressure: The bone operates as a closed compartment, where the bone marrow is encased within rigid cortical bone. An increase in the number of cells or fluid within the marrow can elevate localized pressure, compressing the small blood vessels, including capillaries and sinusoids. This compression reduces blood flow, leading to ischemia and eventual necrosis.
The femoral head is particularly vulnerable due to its enclosed anatomical structure. The overlying cartilage restricts access to local blood vessels, exacerbating the risk of ischemia when blood flow is compromised. For example, trauma, such as a femoral neck fracture, can damage the retinacular vessels that supply the femoral head, leading to AVN.
Understanding these mechanisms is crucial for diagnosing and managing osteonecrosis effectively, as it can help identify at-risk patients and inform treatment strategies aimed at preserving blood flow and bone viability.
Imaging signs of AVN
AVN typically involves the anterior and superior parts of the femoral head. The lesion often appears geographic and is situated in the subarticular region of the femoral head, characterized by serpentine or irregular lines. Associated marrow edema may be present, potentially extending into the intertrochanteric region.
The core of the lesion exhibits variable signal intensities on magnetic resonance imaging (MRI), which can change depending on the stage of the AVN. A hallmark MRI feature of AVN is the “double line sign,” seen as an inner bright line representing granulation tissue and outer dark line representing adjacent fibrotic (or) sclerotic area. This sign is observed in approximately 80–85% of cases. Few research articles suggest that it is partly related to the chemical shift artifact.[2] Joint effusion and synovitis of the hip joint may be present, reflecting inflammatory changes associated with AVN.
Imaging modalities
Radiographs
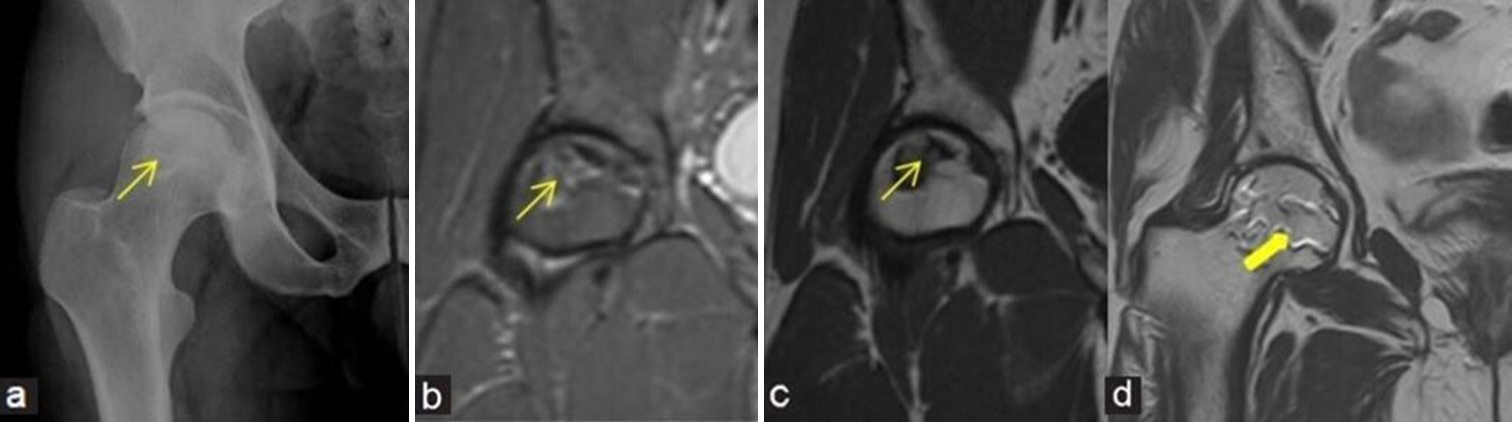
Early signs of osteonecrosis typically cannot be detected on standard radiographs [Figure 1a-d]. It may take up to 3 months for the early signs to become apparent. Initial changes may include minor osteopenia, which can be subtle and easily overlooked. As the condition progresses, patchy sclerosis of the femoral head may develop due to reactive bone formation at the boundary of the necrotic area. The “crescent sign” is a critical radiographic finding, indicating a thin, tangential subarticular fracture line in necrotic bone [Figure 2a-c]. This occurs when the necrotic area is unable to heal, leading to potential collapse of the articular surface. Both frontal and frog-leg views should be obtained to effectively assess for the crescent sign and other relevant changes. Superimposed secondary degenerative changes, such as osteoarthritis, can often be better appreciated on radiographs.
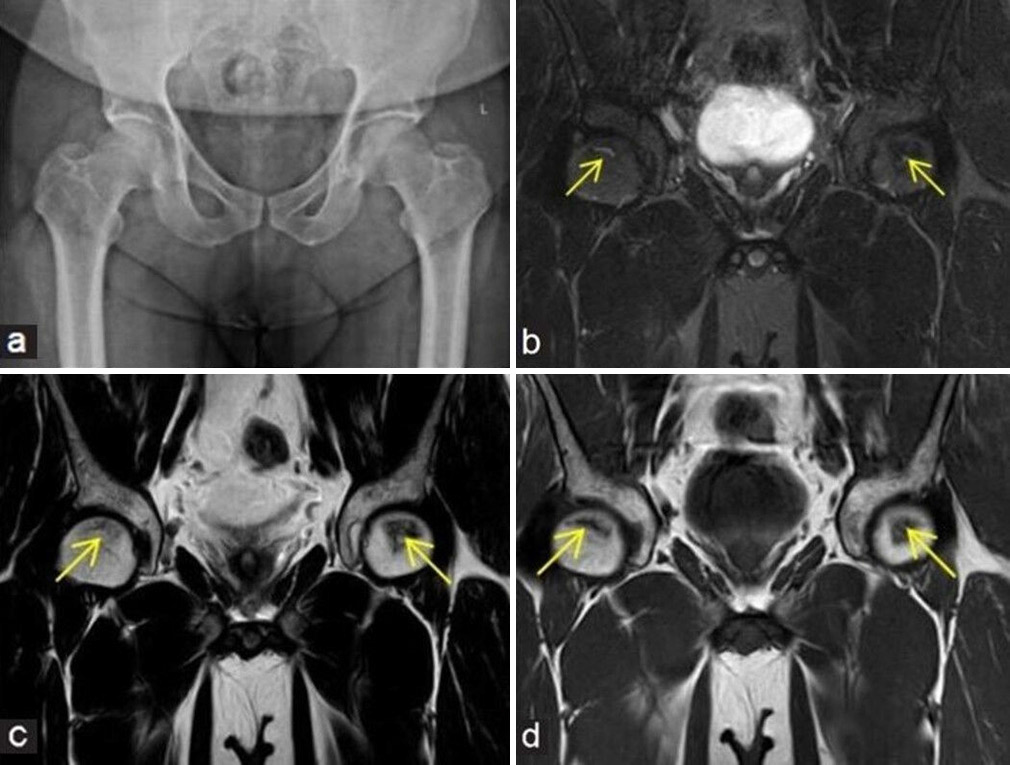
- (a-d) A 48-year man with pain at both hips. (a) Frontal radiograph of pelvis with both hips shows near normal appearance of both femoral heads. In view of high clinical suspicion, an magnetic resonance imaging was performed. (b) Coronal fluid sensitive fat sat, (c) T2W Spin-Echo (SE) images, and (d) T1W SE coronal images depict small geographic areas of early stage of osteonecrosis (yellow arrows in b - d) at anterosuperior aspects of both femoral heads.
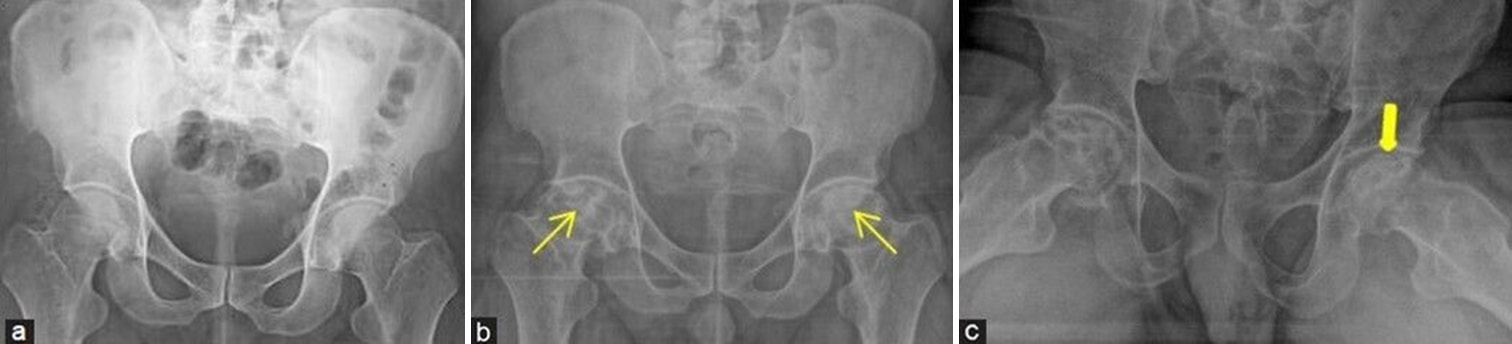
- (a-c) A middle aged man with hip pain and history of steroid usage for COVID. (a) Initial frontal radiograph of pelvis with both hips was presumed to be normal. One and a half year later, due to persistent episodes of pain, radiographs were repeated. (b) Frontal projection shows irregular bordered geographic lesions with mixed sclerotic areas at bilateral femoral heads consistent with avascular necrosis (yellow arrows) and early articular surface collapse. (c) Frog leg view demonstrates the “crescent sign” at the left femoral head which is depicted as curvilinear subarticular lucent fracture line (thick yellow arrow).
Computed tomography (CT)
CT is useful for evaluating the extent of bone involvement in osteonecrosis and can provide detailed information about the structural changes. It effectively depicts subchondral fractures and trabecular disruption which may be difficult to visualize on other imaging modalities. It is generally not the imaging modality of choice due to its inability to detect bone marrow edema (BME) at the early stages. Later stages can potentially appear on CT as irregular areas of osteosclerosis or increased density at femoral head. This indicates reactive changes as the necrotic bone attempts to heal. CT scan can depict femoral head collapse [Figure 3a and b], marginal osteophytes, reduced joint space, and secondary degenerative changes within the affected joint, which are important for assessing the disease progression. Often, osteonecrosis is detected incidentally during abdominal or pelvic CT scans performed for other reasons [Figure 4a and b].
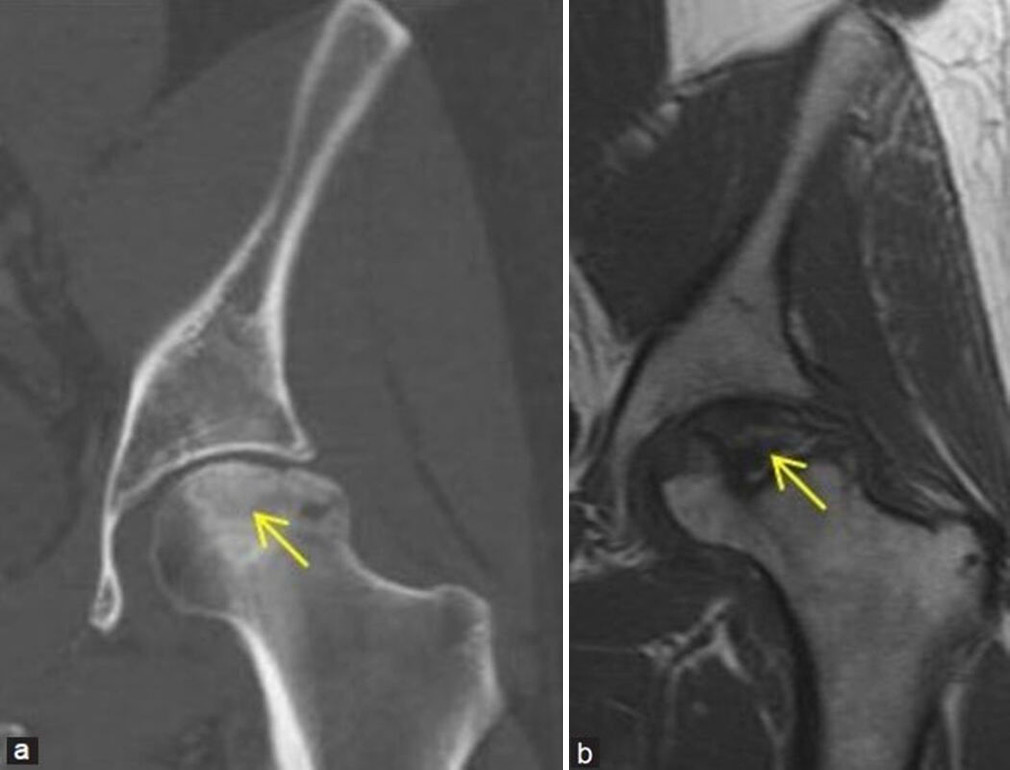
- (a and b) Young man with the left hip pain. (a) Coronal computed tomography reformatted image of the left hip in bony window settings demonstrates irregular bordered sclerotic area at the left femoral head consistent with osteonecrosis (yellow arrow). Articular surface collapse of head is well delineated. (b) Corresponding coronal T1-weighted magnetic resonance image of the left hip of the same patient better depicts the femoral head osteonecrosis and collapse (yellow arrow), suggesting Ficat and Arlet stage 3.
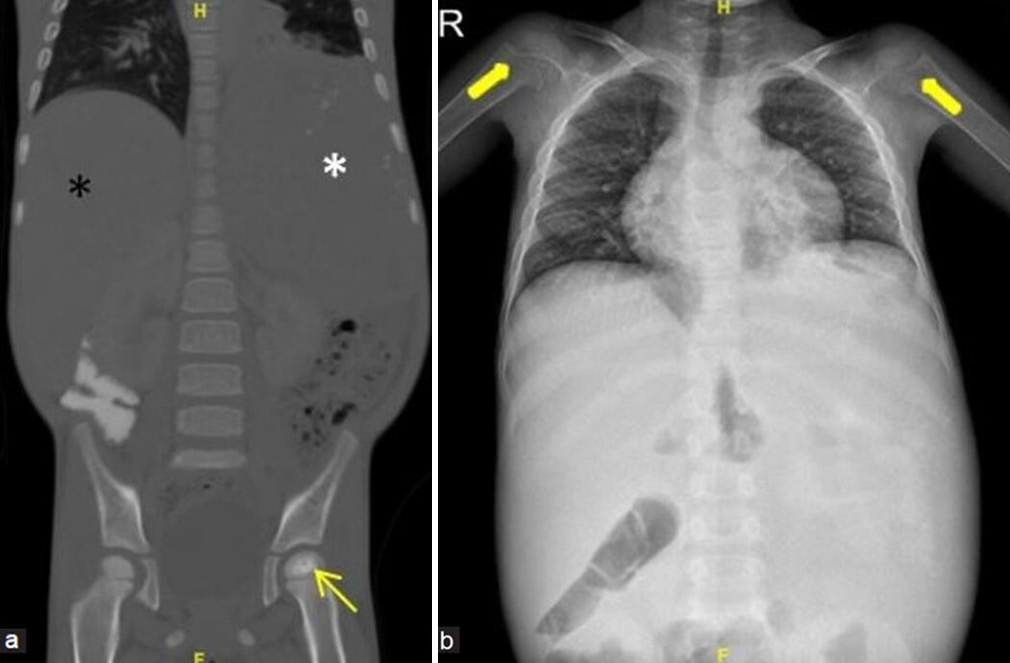
- (a and b) A young boy with episodes of the left hip pain and abdominal fullness. (a) Coronal computed tomography reformatted image of abdomen and pelvis in bony window settings demonstrates sclerosis and irregularity of the left femoral head epiphysis consistent with osteonecrosis (yellow arrow). Enlarged liver (black asterisk) and spleen (white asterisk) are also depicted well. (b) Frontal radiograph of chest and abdomen shows enlarged soft-tissue density shadow at the right and left hypochondriac regions, consistent with hepatosplenomegaly. Widened metaphysis of proximal humeri are also noted (thick yellow arrows). This is a worked up case of Gauchers disease.
MRI
Key MRI sequences and planes [Figure 5a-g and Table 2]:
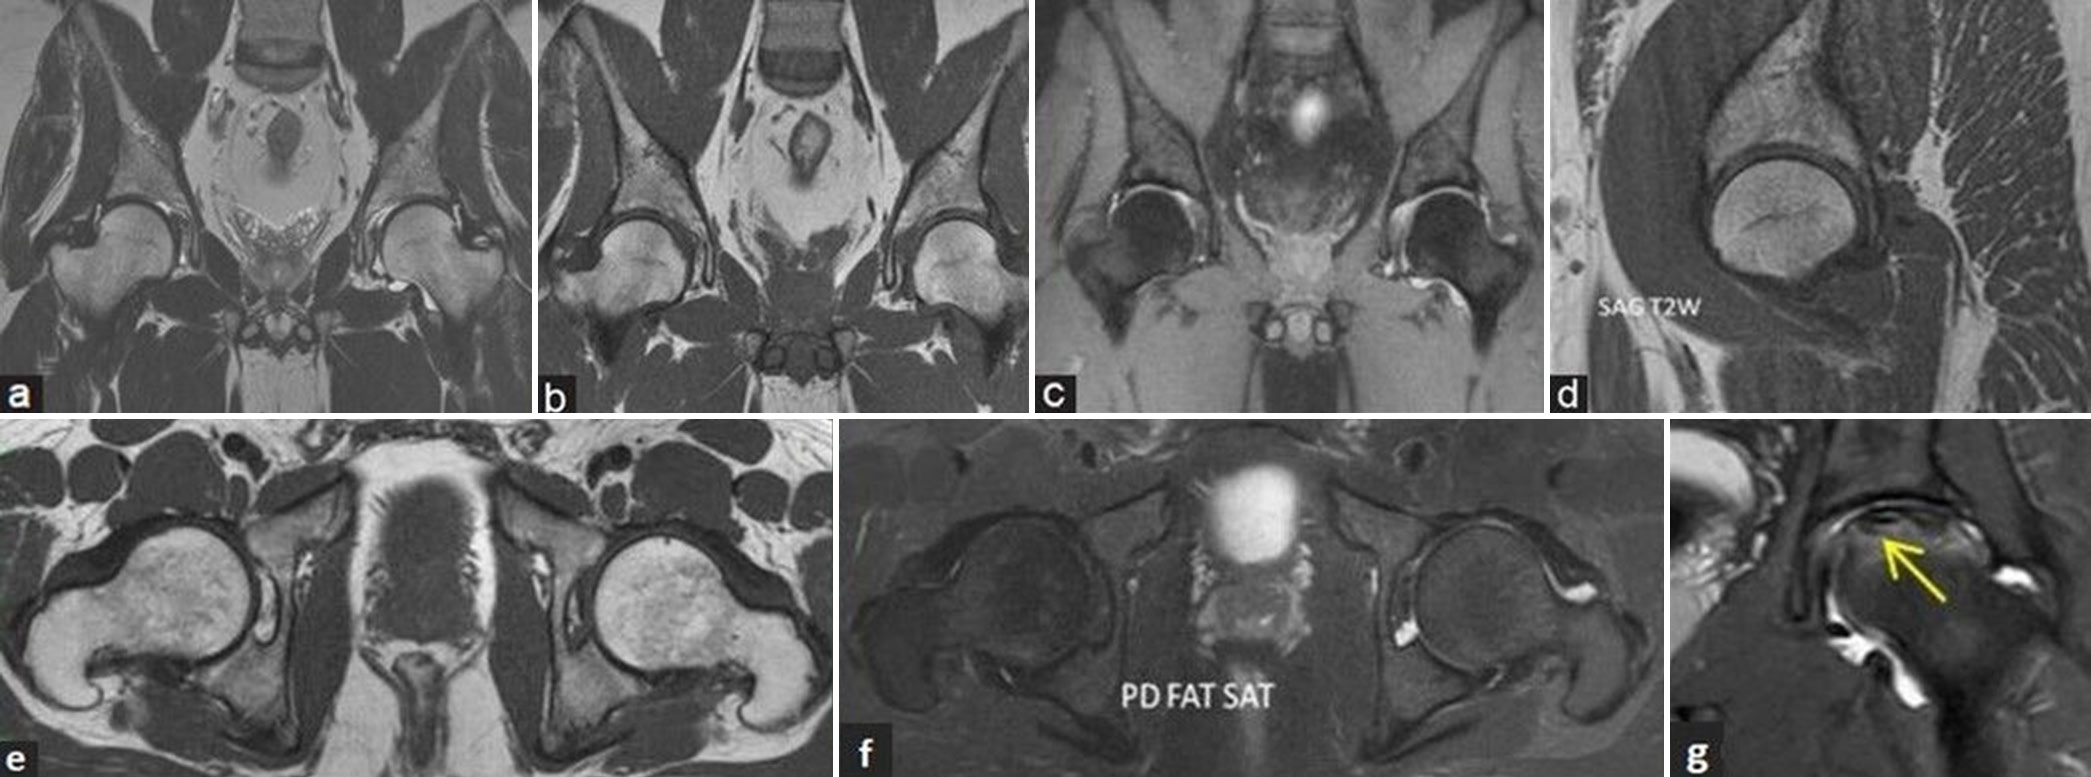
- (a-g) Magnetic resonance (MR) imaging protocol and sequences. (a) Coronal T2-weighted image (T2WI), (b) T1-weighted image (T1WI), and (c) fluid sensitive fat sat (short-tau inversion recovery) MR images of pelvis with both hip joints in a young man showing the area of coverage to include both the hips. (d) Sagittal T2WI MR image of the right hip, (e) axial T1WI, and (f) fluid sensitive proton density (PD) fat sat MR images of both hips depicts the normal morphology of hips. (g) Coronal fluid sensitive PD fat sat MR image of the left hip in another middle aged man showing small field of view coverage depicting osteonecrosis of the left femoral head (yellow arrow).
| Sagittal plane | Axial | Coronal |
|---|---|---|
| Only T2WI or T1WI | T1WI, PD Fat sat | T1WI, T2WI, PD or T2WI FS |
3D PD fat sat or 3D GRE sequence for cartilage assessment Thickness of section: 5 mm for large FOV coronal images, 3.5 mm for all the remaining
FOV: Large FOV (30-40 cm) for both hips, small FOV (14-16 cm) for one side hip.
T1WI: T1-weighted imaging, T2WI: T2-weighted imaging, AVN: Avascular necrosis, FOV: Field of view, PD: Proton density, FS: Fat saturated
Sequences
-
T1-Weighted Imaging: Excellent for assessing marrow signal changes.
Useful in identifying the necrotic bone as the demarcation from adjacent normal bone is rendered conspicuous by the T1 hypointense line.
T2-weighted imaging with fat saturation or short-tau inversion recovery: Best for visualizing classical signs of AVN, such as the “double-line sign,” BME and associated findings such as synovitis and joint effusion.
Plane of acquisition
Apart from the geometrical planar sequences, coronal oblique and axial oblique images with angulations parallel to the femoral neck axis may be included for better assessment of ONFH and BME syndromes.
-
Coronal Planes:
Considered as the primary imaging planes.
Better depicts mediolateral localization of necrosis, useful for evaluating joint space, and extent of articular surface collapse.
-
Axial Planes:
Provide additional information on extent of necrosis but are less critical than coronal sequences.
-
Sagittal Planes:
At least, one sagittal view is essential to assess for subchondral insufficiency fractures (SIFs) and to evaluate early loss of spherical shape of the femoral head.
Advanced MRI techniques
-
Chemical Shift Imaging:
Out-of-phase images can better depict subchondral fractures by highlighting differences in fat and water content.
-
Perfusion Imaging:
Dynamic contrast-enhanced MRI (DCE-MRI) is used as a complementary technique to provide functional information about vascularity and perfusion within the affected areas and thereby helping to differentiate from the lesions mimicking osteonecrosis.
Necrotic area shows markedly reduced perfusion, slow washout, and low peak on the time intensity curve, indicating severe ischemia and impaired blood supply.[3]
Rim of high plasma flow may be seen. Heterogeneous perfusion may indicate patchy areas of ischemia corresponding to early stages.
-
Diffusion imaging:
Can be useful for detecting early changes in osteonecrosis due to increased diffusivity and markedly increased apparent diffusion coefficient values in osteonecrosis compared to the normal femoral head.[4]
As it is difficult to discriminate necrotic from edematous bone marrow by diffusion-weighted imaging (DWI), it is of limited value in the evaluation of BME syndrome of the proximal femur. Further DWI fails to distinguish between the different stages of osteonecrosis. DWI also has the limitation of poor resolution.
MR findings
The infarcted bone may appear normal in the initial months post-infarction. Changes on MRI typically occur once healing begins. Major morbidity arises not from the infarct itself but from the healing process, which can weaken the bone by resorbing dead tissue.
Initial MR findings include non-specific marrow edema, which appears hyperintense on fluid-sensitive sequences and may extend to the femoral neck. There is a significant correlation between the presence of marrow edema and hip pain, with studies indicating a strong relationship (P < 0.0001)[5] and the risk of collapse. The sequence of progression is from normal marrow to hemorrhage, then to edema and finally fibrosis.
A focal serpiginous low-signal intensity line with a fatty center, known as the “reactive interface line,” may form as healing begins. As granulation tissue develops, a “double line sign” may appear on fluid-sensitive sequences, representing the border between viable and non-viable bone [Figure 6]. This sign may be obscured on non-fat suppressed images due to chemical shift artifacts. Osteochondral fragmentation can occur, indicated by surrounding fluid, termed the “rim sign,” suggesting potential instability. Early articular surface collapse is challenging to appreciate on MRI, but sagittal sequences can provide better visualization. It may be easier to detect on plain radiographs. As collapse progresses, changes such as joint space narrowing, subchondral sclerosis, and secondary degenerative arthritis become evident.
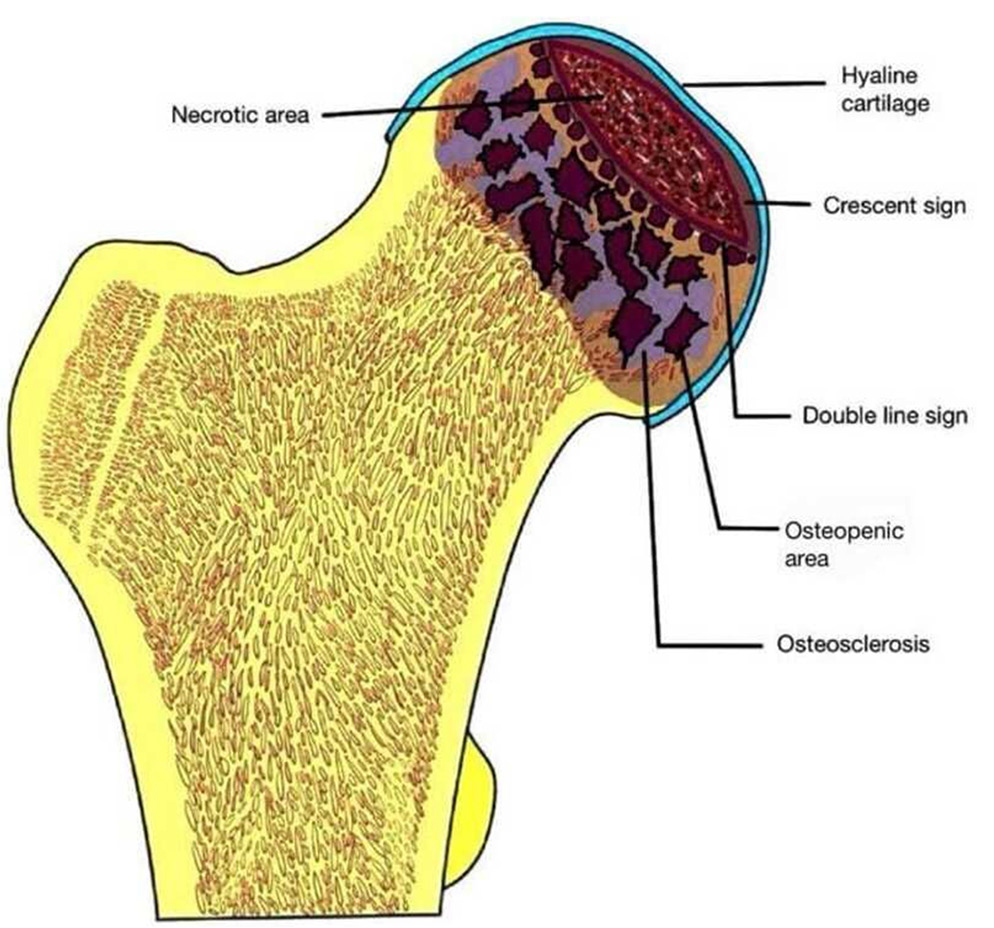
- Schematic diagram depicting the various features of osteonecrosis of femoral head.
On post-contrast studies, decreased enhancement is noted in early osteonecrosis, while absent enhancement in later stages indicates non-viable bone.
Follow-up MRI may be necessary to monitor small asymptomatic lesions for progression. However, follow-up is generally not required once the femoral head has collapsed.
Radionuclide scintigraphy
Shows photopenia at femoral head in early stages, later there is increased radioisotope accumulation due to revascularization and repair. In general, more sensitive than standard radiographs for detecting early changes, but less sensitivethan MR. It can also help in identifying multifocal disease, especially when other imaging modalities are inconclusive.
Recent advances
Artificial intelligence (AI) algorithms are increasingly capable of automatically measuring the necrotic areas on imaging studies, which enhances accuracy and efficiency. These systems can compute grades based on established classification methods, facilitating standardized evaluations across different cases. Deep learning methods with automatic segmentation are being deployed for quantification of osteonecrosis with parameters such as volume of necrosis, percent of necrotic bone volume, surface area of necrotic bone, and percentage of necrotic femoral head surface.[6] By providing detailed quantitative assessments, AI can improve the diagnostic accuracy and prognostic predictions for patients with AVN. As these technologies continue to evolve, they are likely to play an increasingly central role in the diagnosis and treatment of AVN.
BME AND AVN
The relationship between BME and AVN remains a topic of ongoing research and debate. BME was initially thought to be an early sign of AVN that could progress into typical disease patterns.[7-11] BME alone as starting point of AVN or earliest stage of AVN is not agreed by many authors.
At present, BME when seen along with the signs of AVN is recognized as a marker of advanced AVN and is associated with a poor prognosis. It typically manifests after the appearance of the band-like sign, which is the earliest indicator of AVN. Furthermore, BME correlates with subchondral fractures and an increase in pain severity.[7-10]
CLASSIFICATION SYSTEMS
Several classification systems are commonly used to grade the severity and stage of the disease. While each system has its nuances, they generally aim to provide a framework for understanding the extent of bone involvement and guiding treatment decisions.[12,13] The main systems that are widely used are depicted [Table 3].
| S. No. | Classification system | Merits | Limitations |
|---|---|---|---|
| 1 | Modified Ficat and Arlet staging | Most widely used in reporting and combines clinical symptoms, radiographic and magnetic resonance imaging findings. | No quantitation of size of lesion, so not possible to measure subtle degrees of progression, no subclassification of amount of head depression |
| 2 | Steinberg Classification | Assesses percentage of femoral head involvement | Volume measurements may be time consuming if special software is not used |
| 3 | ARCO classification (Association Research Circulation Osseous classification) | Incorporates location, area of involvement, quantitates surface collapse | No general consensus supporting this system |
| 4 | Japanese Investigation Committee (JIC) classification | Incorporates location in its classification and stratification of the disease | Location is not as helpful as size of lesion. No method to evaluate preradiographic lesions or lesions in which joint line and acetabulum are involved |
| 5 | Mitchells magnetic resonance imaging staging | Provides pathophysiologic information of core and the disease progression | No percentage or staging Often overlap of the different categories found in the same hip Difficult to recognize the hemorrhage (unless T1 fat sat imaging is performed) |
Practical tip: The authors recommend following any of the classification system which is clinically relevant, and most of the users follow Modified Ficat and Arlet system.
Modified Ficat and Arlet staging
The Ficat and Arlet classification system was indeed the first to introduce a structured approach for grading AVN of the femoral head [Figure 7]. Since its inception, it has undergone several modifications to enhance its clinical relevance, particularly with the incorporation of MRI findings [Figures 8-12]. It is divided into five stages and combines clinical symptoms, radiographic findings, and MRI to assess the severity of osteonecrosis and track the disease progression Table 4. It considers various features such as presence of BME, crescent sign, double line sign, cortical collapse, and degenerative arthritis changes along with clinical symptoms such as pain, stiffness, or limp.
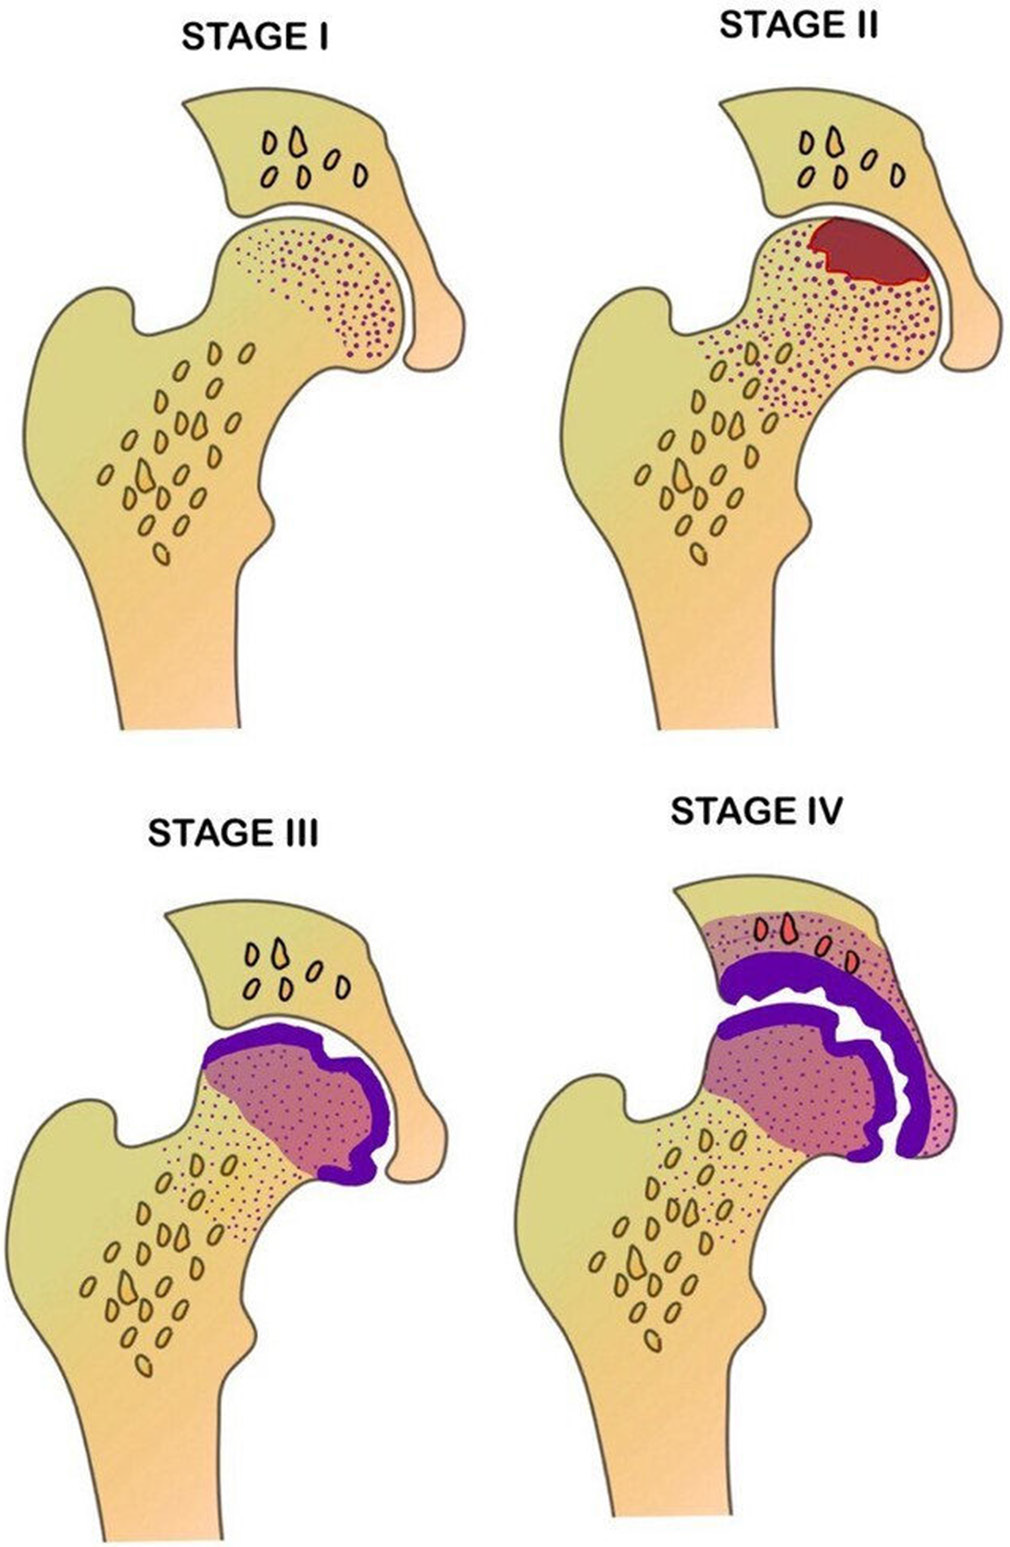
- Schematic diagram depicting the various stages of osteonecrosis based on modified Ficat and Arlet staging.
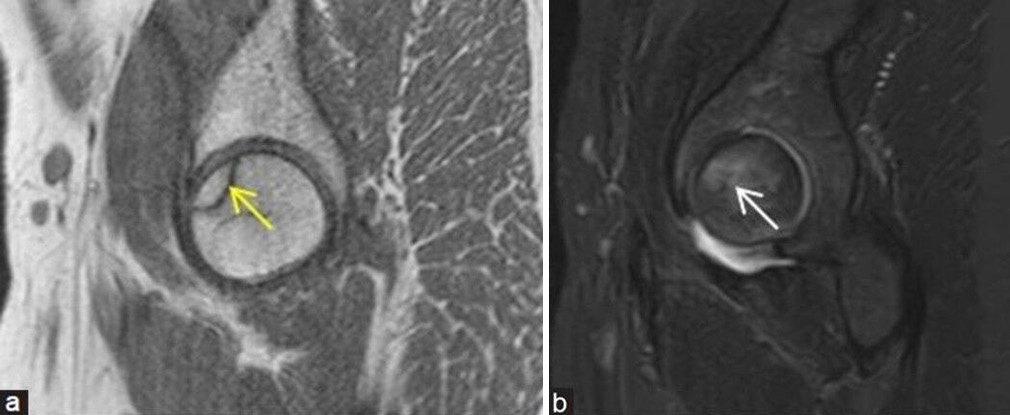
- (a and b) Stage 1 avascular necrosis (Ficat and Arlet): (a) Sagittal T1-weighted image magnetic resonance (MR) image in a young man showing single hypointense line (yellow arrow) at anterosuperior aspect of femoral head with (b) bone marrow edema (white arrow) better depicted on the sagittal fat sat MR image.
- (a-d) Stage 2 avascular necrosis (Ficat and Arlet): (a) Frontal radiograph of the right hip in a 47-year man shows geographic lesion with sclerotic margin (yellow arrow) at femoral head. (b) Coronal Proton density fat saturated image and (c) T1-weighted image magnetic resonance (MR) images also demonstrate similar findings of geographic lesion (yellow arrows). (d) Coronal T2-weighted image MR images in a different patient depict the classical appearance of “Double-line sign” (thick yellow arrow) at the right femoral head with inner bright and outer dark lines.
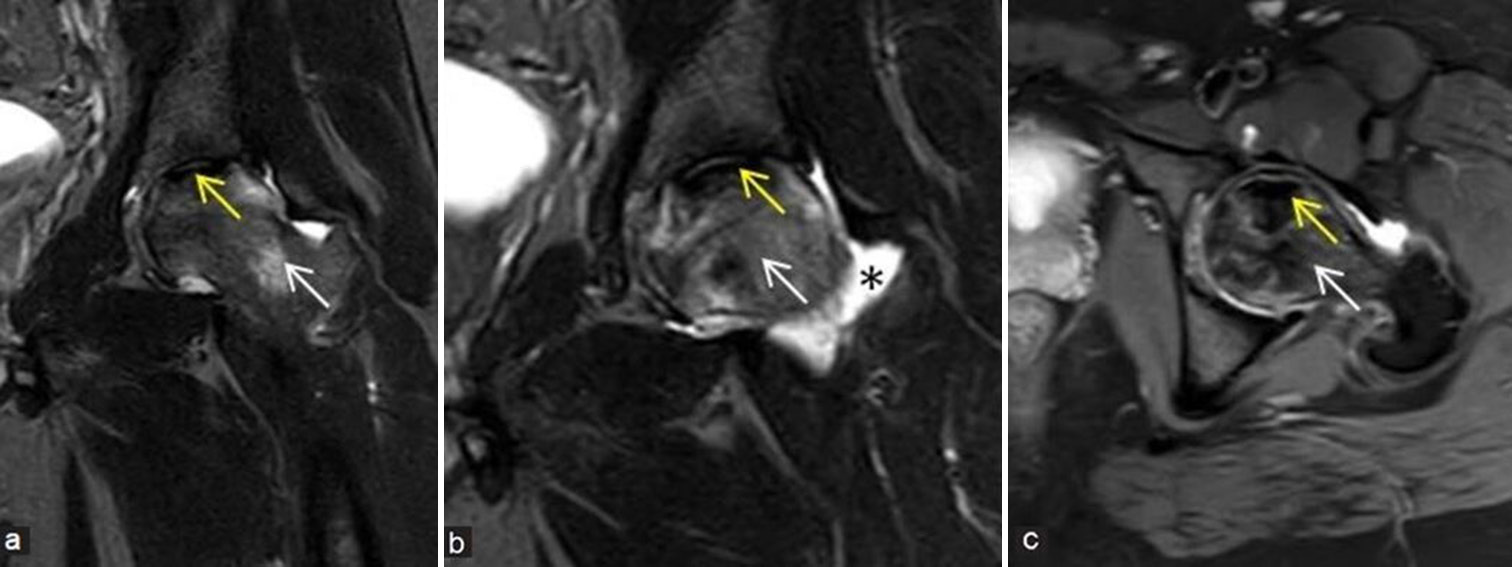
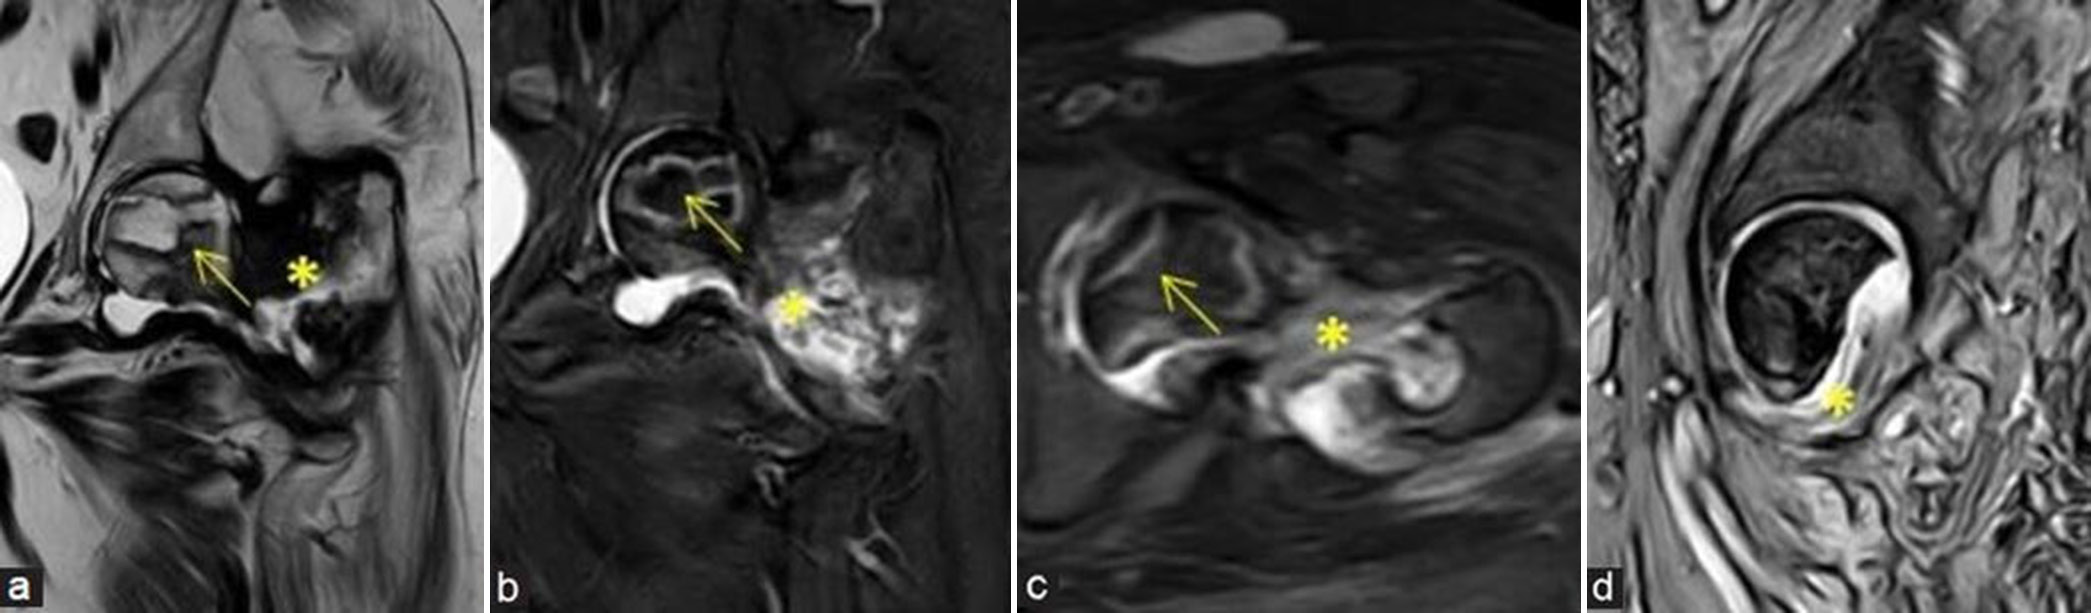
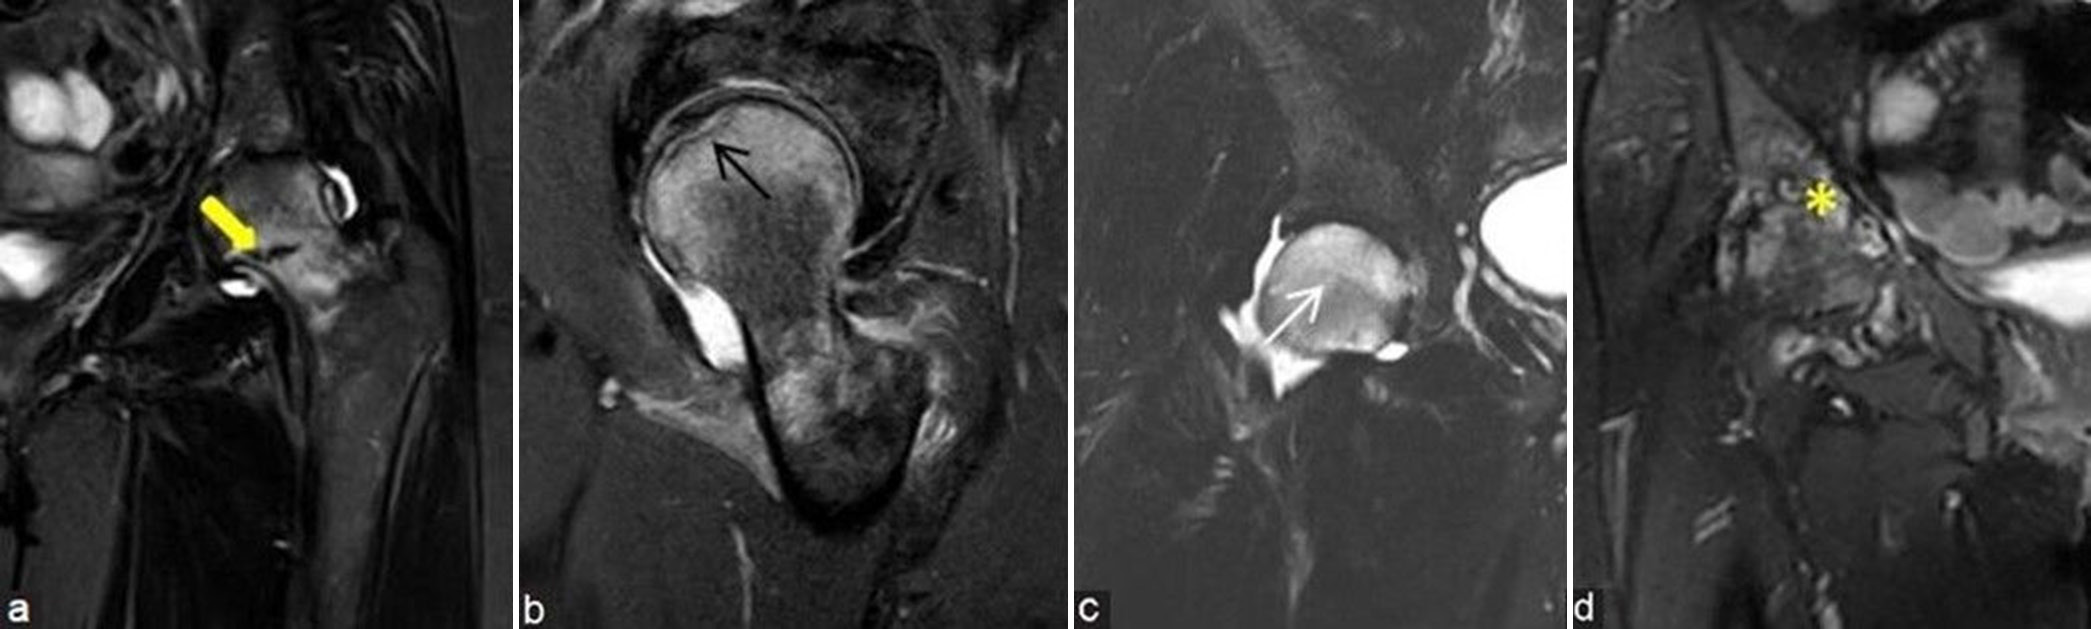
- (a-c) Precollapse or impending collapse: (a and b) Coronal and (c) axial fluid sensitive short-tau inversion recovery magnetic resonance images of the left hip in a young man demonstrate avascular necrosis (yellow arrows) at left femoral head with prominent edema pattern (white arrows) at femoral head and neck regions with associated mild left hip joint effusion (black asterisk), findings suggesting impending collapse. These findings also correlate with a painful hip and indicates poor prognostic feature.
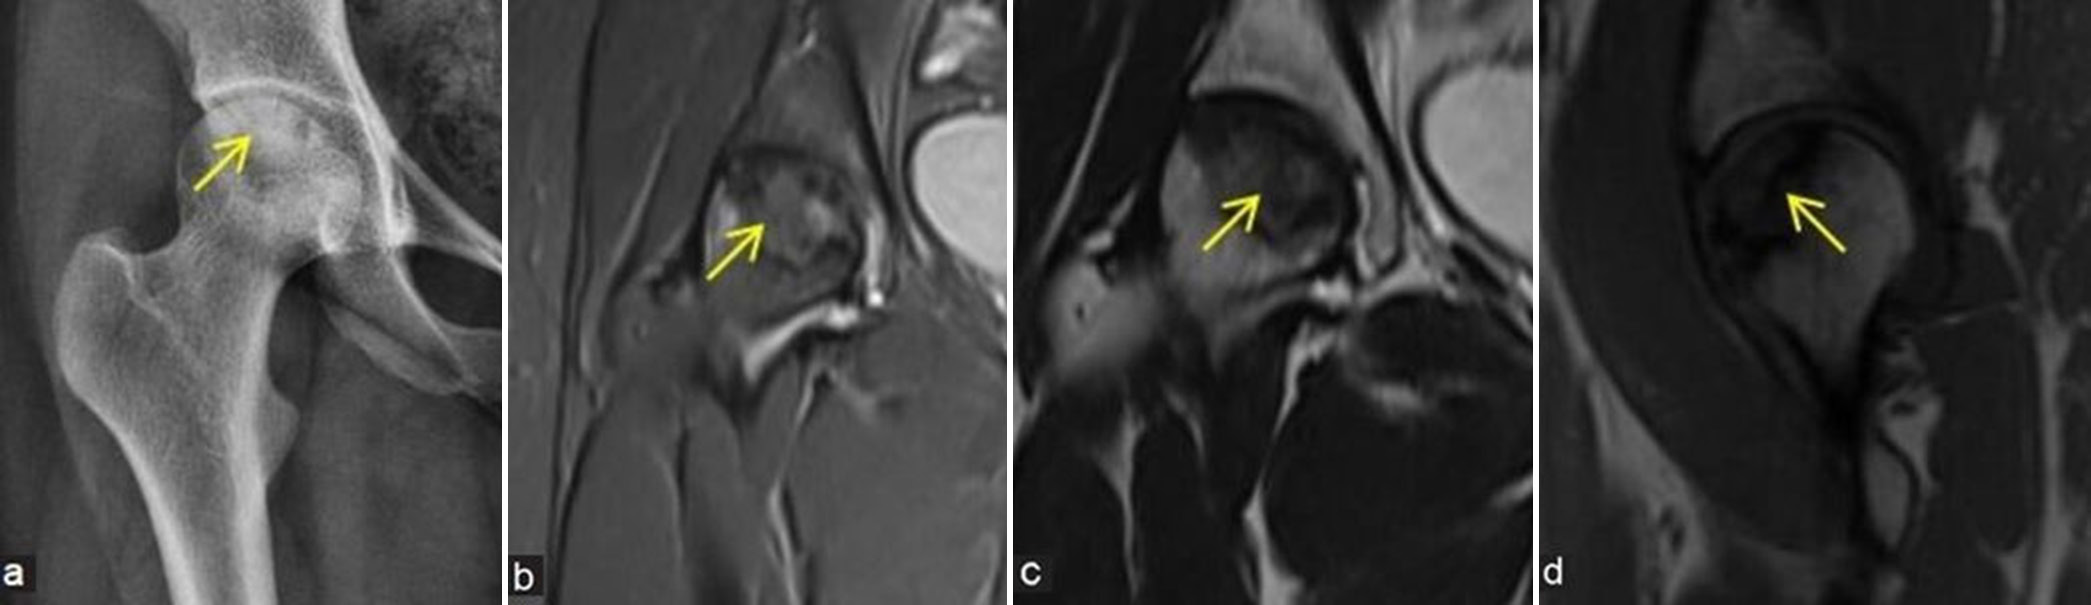
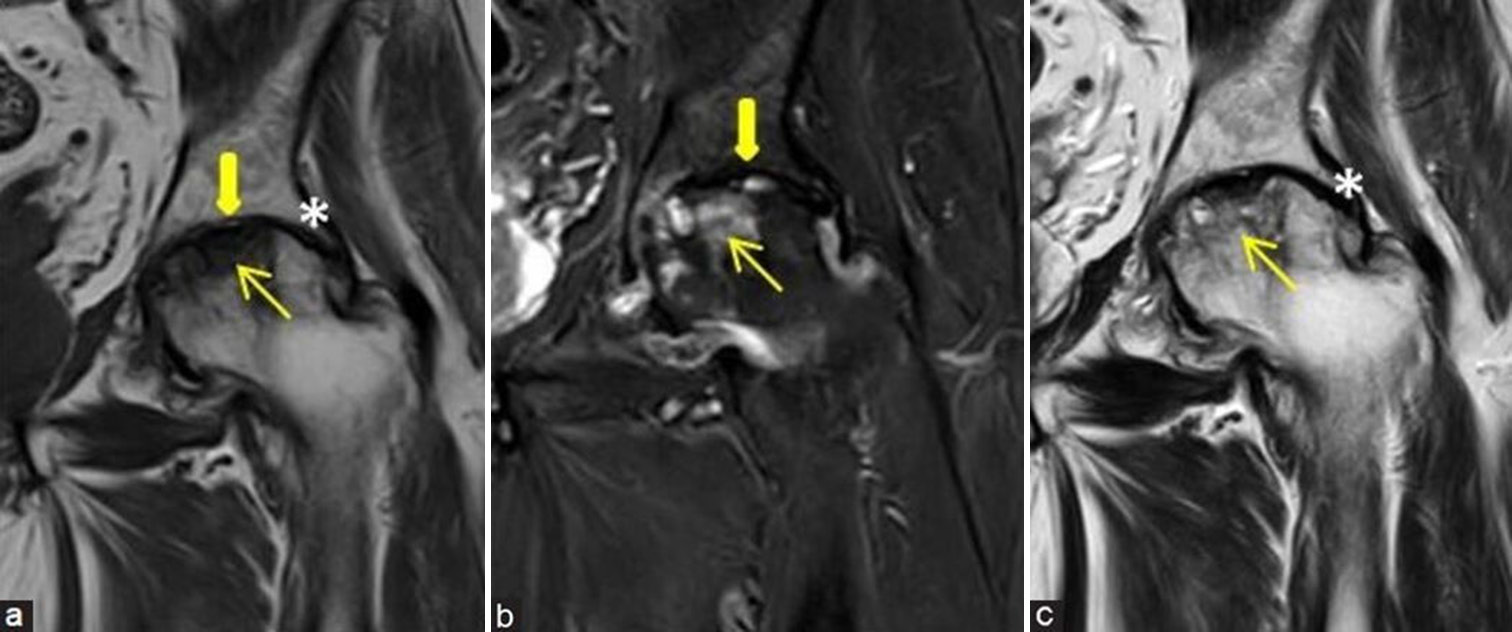
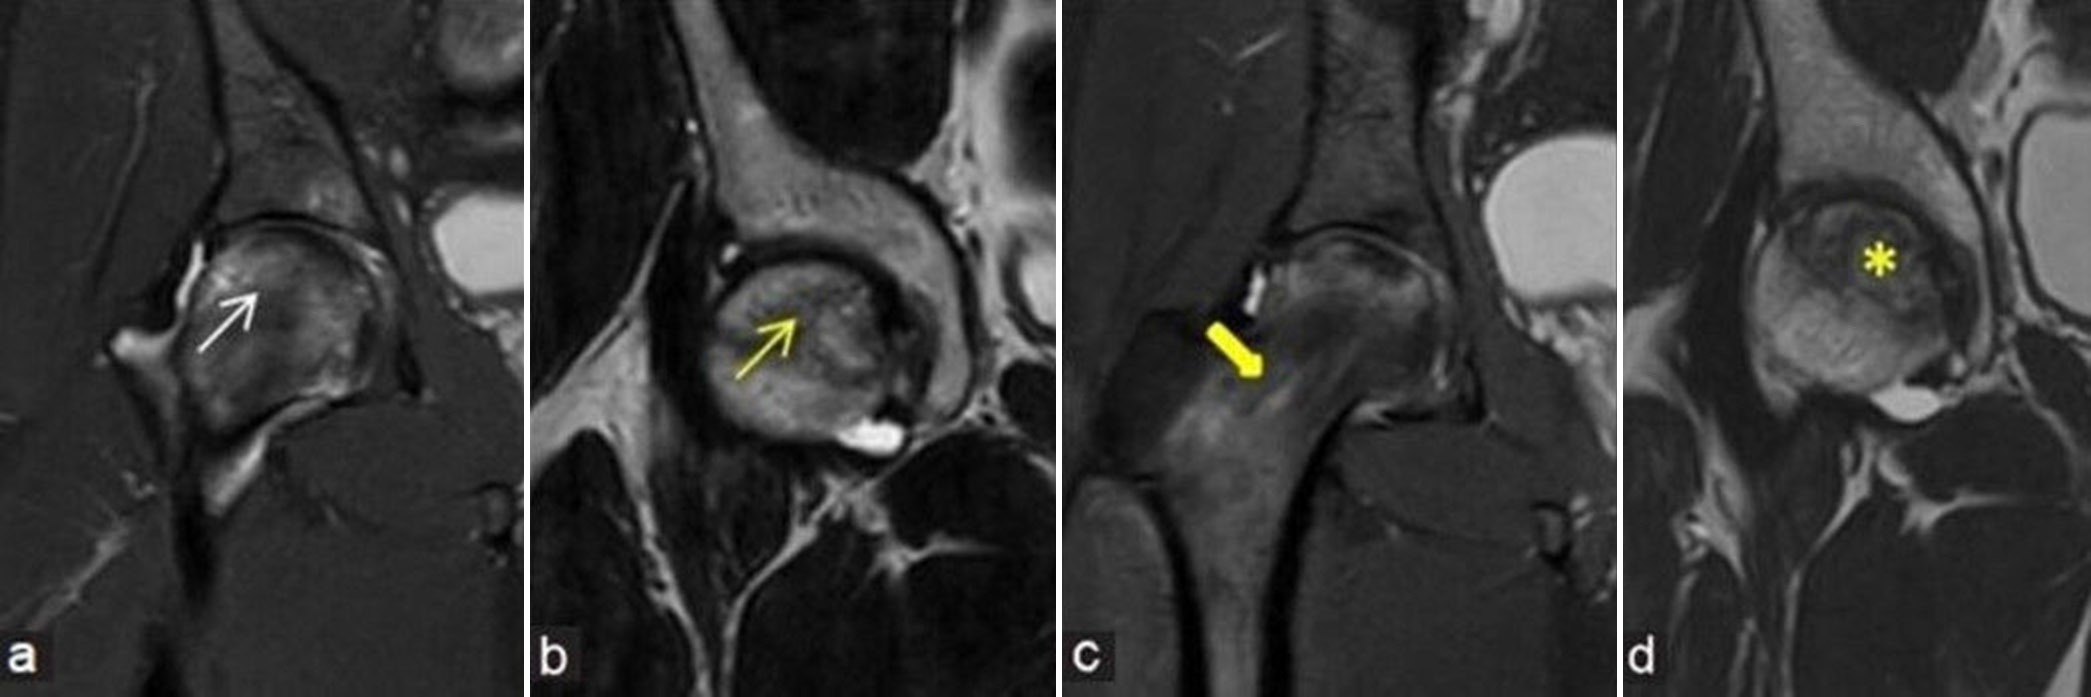
- (a-d) Stage 3 avascular necrosis (Ficat and Arlet): (a) Frontal radiograph of the right hip in a 24-year young girl shows geographic lesion with sclerotic margin at femoral head (yellow arrow) with associated early cortical collapse. (b) Coronal proton density fat sat, (c) T2-weighted image, and (d) sagittal T1-weighted image images also demonstrate similar findings (yellow arrows).
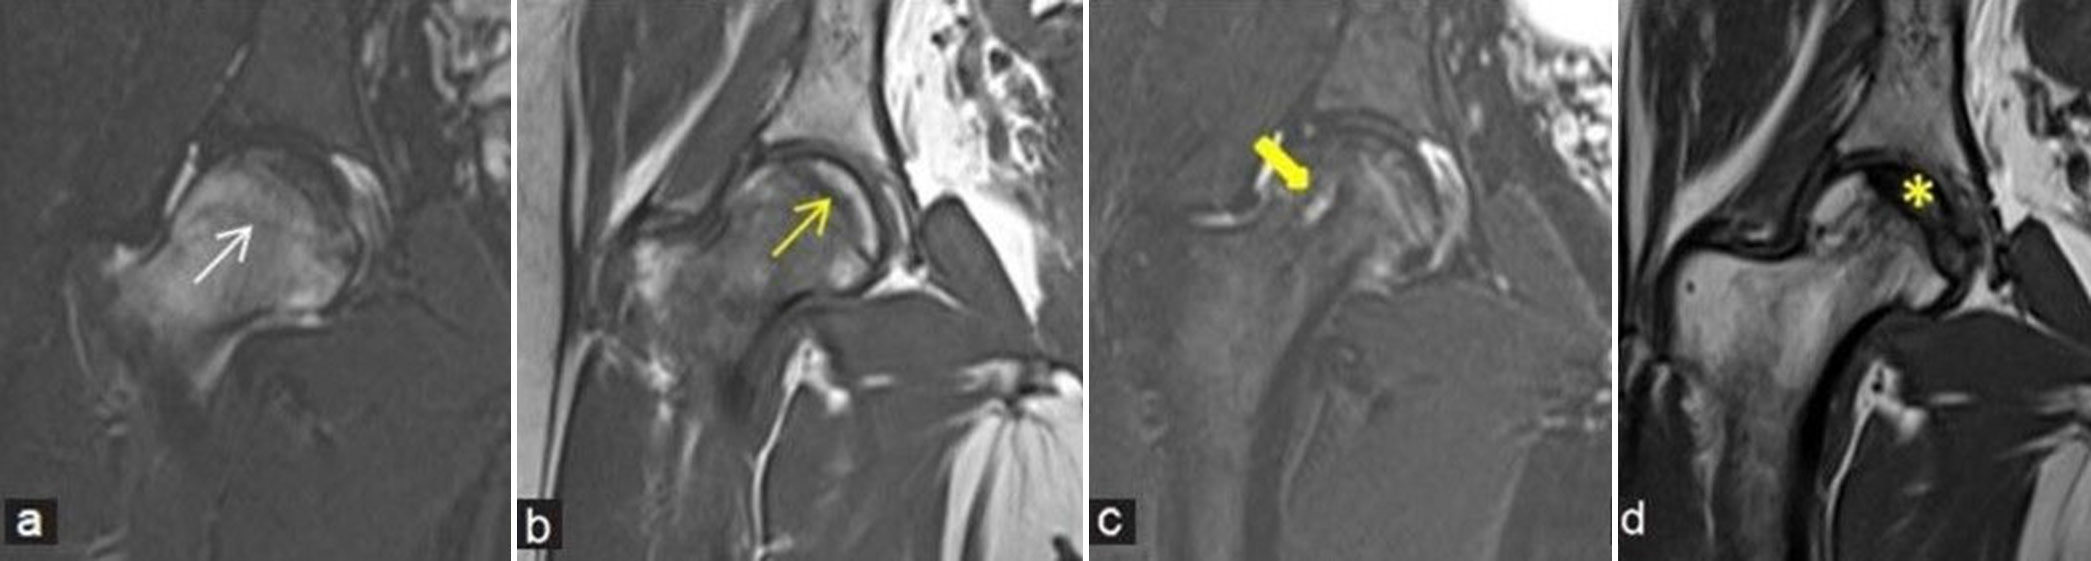
- (a-c) Stage 4 avascular necrosis (Ficat and Arlet): (a) Coronal T1-weighted image, (b) short-tau inversion recovery, and (c) T2-weighted image magnetic resonance images of the left hip of a middle aged man shows evident collapse of femoral head (yellow arrows) with secondary degenerative arthritis of the left hip showing subarticular cysts, reduced joint space (thick yellow arrows), cartilage loss, and marginal osteophytes (white asterisk in a and c).
| Stage | Radiography | Magnetic resonance imaging | Clinical symptoms |
|---|---|---|---|
| 0 | Normal | Normal | Nil |
| I | Normal or minor osteopenia | Edema±faint T1 line | Groin pain |
| II | Mixed osteopenia and sclerosis, cysts | Geographic defect, edema beyond the core, double line sign | Pain and stiffness |
| III | Crescent sign and cortical collapse | Cortical collapse, subchondral fracture | Pain and stiffness±radiating pain and limp |
| IV | End stage with secondary degenerative changes | Secondary degenerative changes | Pain and limp |
Practical tip: Incorporating quantification adjectives like percentage of femoral head involvement can enhance the clarity and precision of descriptions when using this classification system.
Steinberg classification
It is one of the first systems to incorporate lesion size into the classification. It is divided into seven stages and takes into account various criteria such as percentage of femoral head affected, cystic or sclerotic changes, subchondral collapse, flattening, and secondary degenerative changes.
Association research circulation osseous classification
It is also based on the Steinberg’s system and takes into account percentage area of involvement, length of crescent, surface collapse, and dome depression.
Japanese investigation committee classification
Takes location of the lesion into consideration and stages osteonecrosis into three main categories.[14]
Mitchells MRI staging
This grading system, which assesses the signal intensity of the osteonecrosis core, provides crucial information about the disease progression from normal fatty marrow to more advanced stages involving hemorrhage, edema, and fibrosis. It is graded from A to D depending on the content (A: Fat, B: Blood, C: Fluid, and D: Fibrous tissue) [Figure 13a-d].
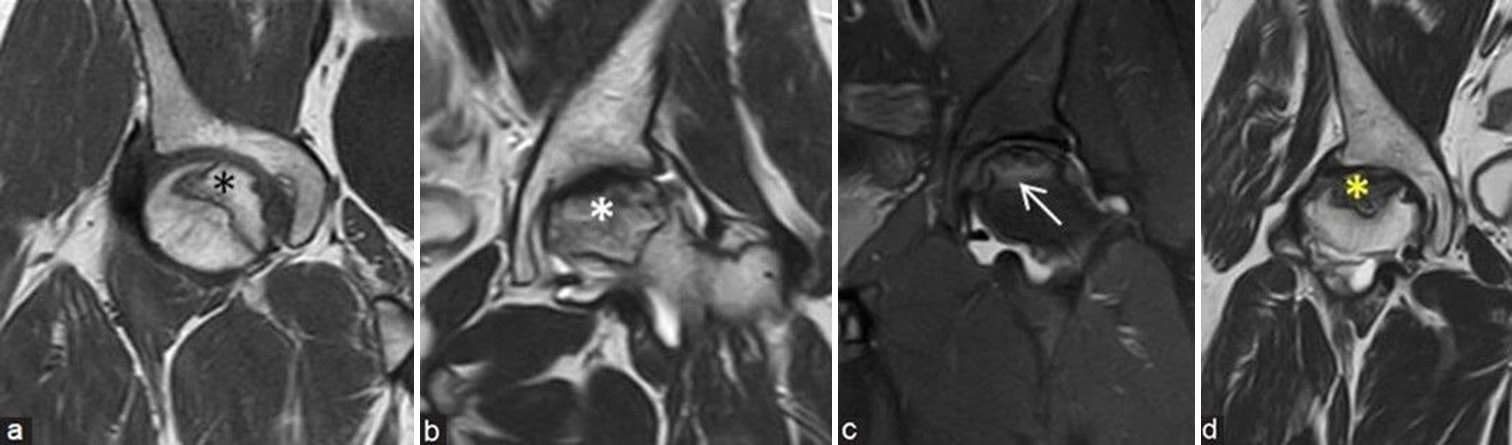
- (a-d) Mitchells magnetic resonance imaging (MRI) staging depends on the signal intensity of osteonecrosis core: (a) Coronal T1-weighted image MRI of the right hip in a young man shows hyperintense fatty signals (fat: stage A) (black asterisk), (b) coronal T2-weighted image (T2WI) MRI of the left hip in a middle aged man shows intermediate and hyperintense T2 signals (blood: stage B) (white asterisk), (c) coronal short-tau inversion recovery MRI of the left hip in a young man shows hyperintense edematous signals (fluid: stage C) (white arrow), and (d) coronal T2WI MRI of the right hip in a middle aged man shows hypointense T2 signals (fibrous: stage D) (yellow asterisk).
Modified Kerboul angle/combined necrotic angle
The osteonecrosis angle measurements are taken at mid sagittal and mid coronal planes of the femoral head and are added together to obtain the combined angle [Figure 14a and b]. This method utilizes the size of the lesion to predict the subsequent risk of collapse.[15] A larger combined angle typically indicates a higher risk of collapse. Another method termed modified necrotic index was advocated by Cherian et al.[16] which is more sensitive focusing on the section of maximal lesion size rather than using mid-plane measurements.
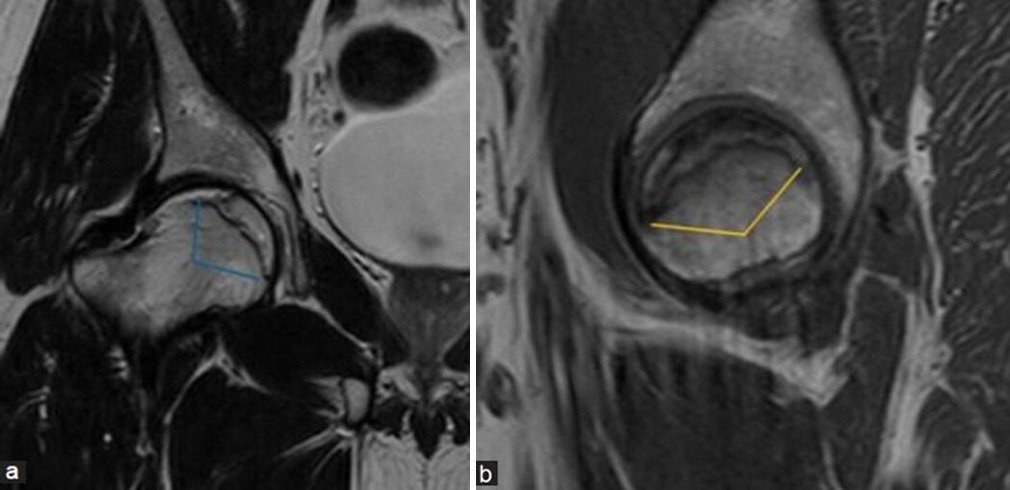
- (a and b) Modified Kerboul angle/combined necrotic angle: This measurement is done by adding arc of femoral head osteonecrosis on a (a) mid-coronal and (b) mid-sagittal image. It is used to assess the risk of head collapse where an angle <190 degrees indicates low-risk group, 190 to 240 degrees indicates moderate risk group, and more than 240 degrees indicates high risk for collapse.
Some examples showing few etiologies for ONFH [Figures 15-18].
![(a-e) A young man with pain at both hips. (a) Frontal radiograph of pelvis with both hips shows irregular bordered geographic lesions with lucent areas at bilateral femoral heads (yellow arrows) and also along the acetabular margins (thick yellow arrow). Patchy sclerosis also noted at bilateral sacroiliac joints (yellow asterisks). (b) Coronal T2-weighted image magnetic resonance (MR) image demonstrates osteonecrosis at bilateral femoral heads (yellow arrows). (c) Coronal fluid sensitive fat sat (Short-tau inversion recovery [STIR]) MR images of both legs demonstrate medullary bone infarcts in bilateral tibia at proximal and middle third regions (black asterisks). (d) Lateral view radiograph of lumbar spine depicts mild depression of central plateau with “H”-shaped appearance in mid lumbar vertebra (black arrow). (e) Coronal long Field of view STIR MR image of dorsolumbar region depicts small sized spleen (white asterisk). All these features represent spectrum of findings in a patient with sickle cell anemia.](/content/107/2025/7/1/img/IJMSR-7-077-g015.png)
- (a-e) A young man with pain at both hips. (a) Frontal radiograph of pelvis with both hips shows irregular bordered geographic lesions with lucent areas at bilateral femoral heads (yellow arrows) and also along the acetabular margins (thick yellow arrow). Patchy sclerosis also noted at bilateral sacroiliac joints (yellow asterisks). (b) Coronal T2-weighted image magnetic resonance (MR) image demonstrates osteonecrosis at bilateral femoral heads (yellow arrows). (c) Coronal fluid sensitive fat sat (Short-tau inversion recovery [STIR]) MR images of both legs demonstrate medullary bone infarcts in bilateral tibia at proximal and middle third regions (black asterisks). (d) Lateral view radiograph of lumbar spine depicts mild depression of central plateau with “H”-shaped appearance in mid lumbar vertebra (black arrow). (e) Coronal long Field of view STIR MR image of dorsolumbar region depicts small sized spleen (white asterisk). All these features represent spectrum of findings in a patient with sickle cell anemia.
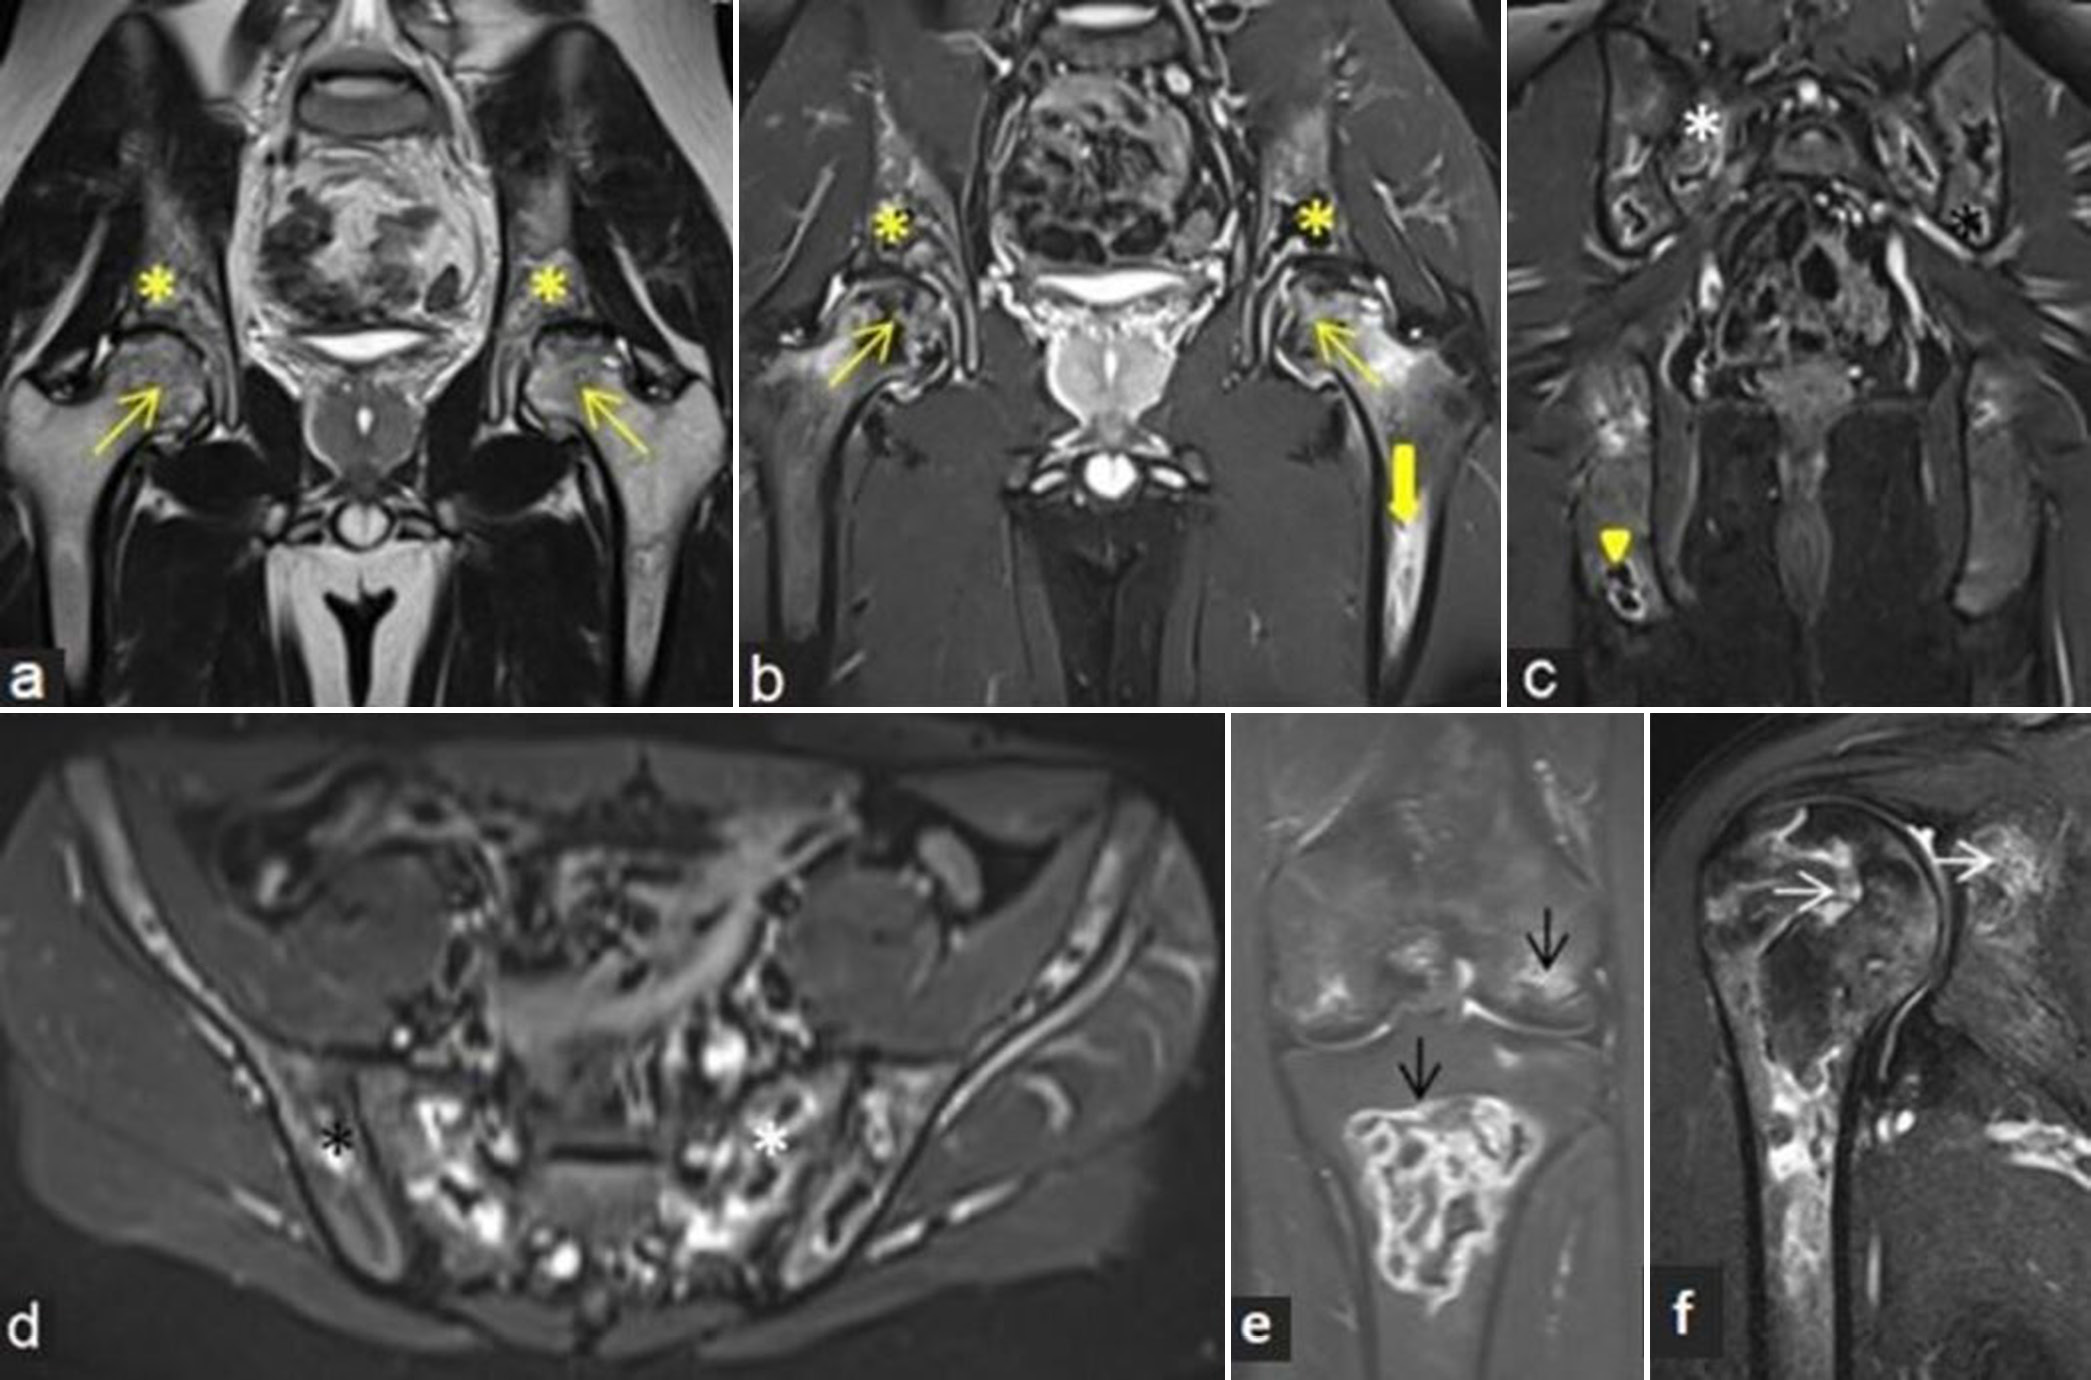
- (a-f) A 19-year child with known acute lymphoblastic leukemia presented with bone pains at multiple sites. (a) Coronal T2-weighted image and (b) proton density fat sat magnetic resonance images of bony pelvis with both hips showing osteonecrosis at bilateral femoral heads (yellow arrows) with associated adjacent marrow edema. Similar lesions are also noted along bilateral acetabular margins (yellow asterisks) and left femoral diaphysis (thick yellow arrows). (c) Coronal and (d) axial short-tau inversion recovery (STIR) images of bilateral pelvic bones including sacroiliac joints demonstrate multiple areas of osteonecrosis with peripheral bright signal intensity involving sacrum (white asterisk), iliac (black asterisk), and ischial bones. (e) Coronal STIR images of the right knee and (f) shoulder depict osteonecrosis in distal femur, proximal tibia (black arrows), and proximal humeral and glenoid margin (white arrows).
- (a-d) Post-traumatic avascular necrosis: A 65-year lady with prior surgery and recent implant removal with non-united intertrochanteric fracture at the left proximal femur and secondary infection at fracture site. (a) Coronal T2-weighted image, (b) coronal short-tau inversion recovery (STIR), (c) axial STIR, magnetic resonance (MR) images and (d) sagittal gradient MR images demonstrate avascular necrosis at the left femoral head (yellow arrows) showing double line sign with old non-united and infected intertrochanteric fracture (yellow asterisks).
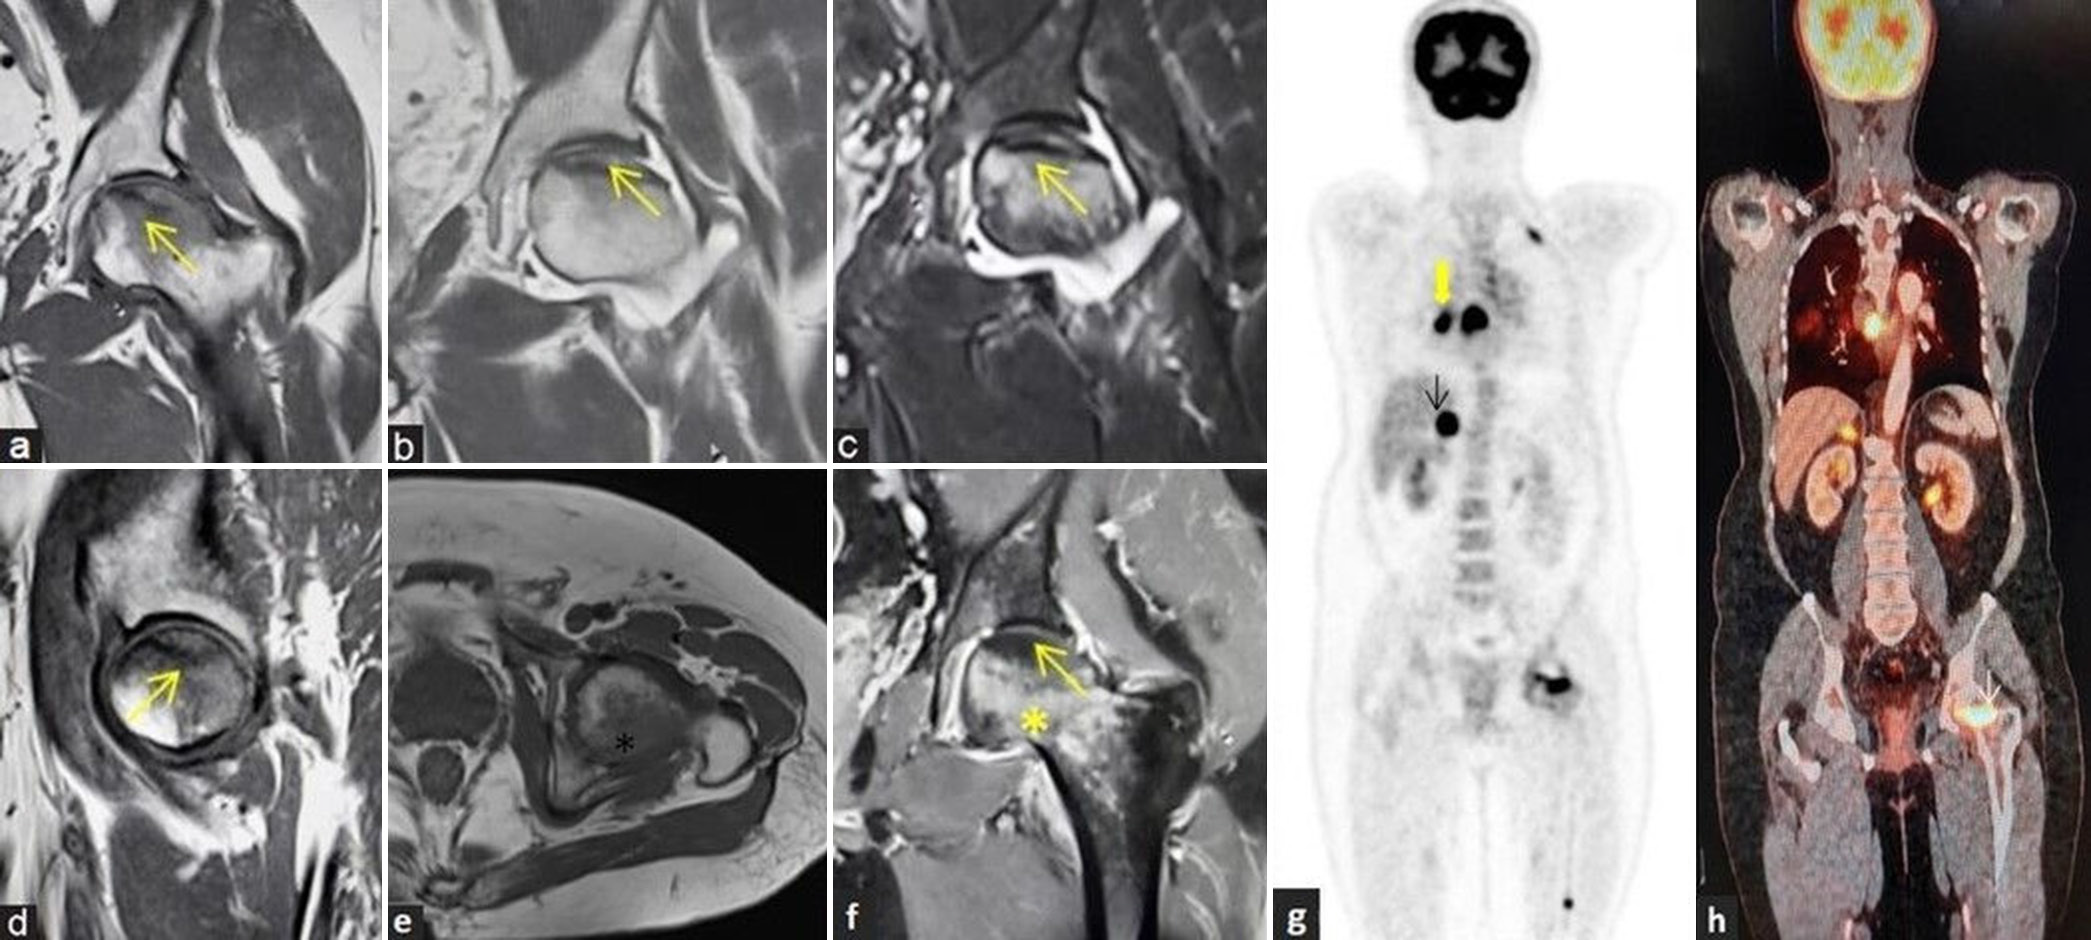
- (a-h) avascular necrosis in a case of metastasis: A 67-year man with acute left hip pain. (a) Coronal T1-weighted image (T1WI), (b) T2-weighted image, (c) short-tau inversion recovery magnetic resonance images, and (d) sagittal T1WI images of the left hip demonstrate avascular necrosis at the left femoral head (yellow arrows) with geographic margin and associated left hip joint effusion. (e) Irregularly marginated lesion appearing hypointense in axial T1WI sequence noted at posterolateral part of the left femoral head (black asterisk). (f) Post-contrast T1W coronal image shows non-enhancing area at the site of osteonecrosis (yellow arrow) with increased marrow enhancement within the lesion at posterolateral femoral head (yellow asterisk). (g and h) Whole body positron emission tomography computed tomography imaging was performed and coronal images depicting increased uptake at primary in the lung (thick yellow arrow), metastatic mediastinal nodes, metastatic right adrenal nodule (black arrow), and metastatic foci to the left femoral head (white arrow) and lower femoral diaphysis.
Reporting Checklist for AVN
When reporting on AVN, it is important to provide a comprehensive assessment that includes the following elements:
-
Confirmation of AVN:
Clearly state whether AVN is present or not. Highlight key imaging clues that support the diagnosis (e.g., marrow signal changes and double-line sign).
-
Percentage of Involvement:
Estimate the percentage of the femoral head involved (e.g., <30%, 30–50%, and >50%).
-
Extent and Location:
Specify the extent of involvement (e.g., focal, segmental, or global). Note the location within the femoral head (e.g., anterosuperior and posterior).
-
Bone Edema:
Report on the presence and extent of edema seen on T2WI or fat-saturated images. Describe any associated changes in the marrow signal.
-
Presence of Subchondral Fracture or Collapse:
Identify any subchondral fractures or signs of collapse (e.g., crescent sign). This may help to make surgical decisions. Mention the stability of the bone structure.
-
Status of the Joint:
Assess the condition of the hip joint (e.g., normal, signs of osteoarthritis, and joint effusion). Describe any secondary changes in the articular cartilage.
-
Staging:
Utilize a staging system (e.g., Ficat and Arlet) to classify the severity of AVN. Provide a stage based on imaging findings.
-
Assessment of the Opposite Side:
Evaluate and report on the opposite hip for any signs of AVN, as bilateral involvement is common.
-
Etiology:
Look for clues that might indicate the underlying cause of AVN.
Note any relevant marrow signal changes that could suggest systemic issues.
Natural history and progression
In some cases, AVN may experience spontaneous revascularization without leading to further progression of the disease.[17] This phenomenon, while uncommon, can result in stabilization of the affected area. It generally proceeds to flattening, collapse of head, and then to secondary degenerative arthritis of hip. Sclerotic lesions on radiographs are said to have a positive prognostic sign, whereas the presence of cystic lesions has increased risk of failure at total hip resurfacing.[5] Involvement of more than 50% of weight-bearing surface has a poorer prognosis with high risk of collapse.
MANAGEMENT
Non-operative management of early lesions (Stage 0–2) is conservative and includes bisphosphonate therapy, anticoagulants, statins, and pain medications. Usage of walkers and crutches can reduce weight on the affected hip thereby alleviating pressure and pain. Physical therapy can be done for strengthening hip muscles to improve stability and function.
When considered, the primary aim of surgery is to relieve pain and minimize pressure on the femoral head to prevent progression of the disease.[18] In lesions where bone contour is intact, femoral head sparing procedures are done. Core decompression (CD) can be performed with or without bone grafting to slow or stop the femoral head collapse or an unloading osteotomy can be performed to relieve pain where a wedge of bone is removed. When bone grafting is performed, either free vascularized or modified avascular fibular grafts may be used; however, it is a complex procedure with a steep learning curve.[19,20] Femoral heads with both double line sign and adjacent marrow edema are known to do significantly worse after CD when compared to those with only a double-line sign.[21] Studies have also shown that combining bisphosphonate therapy with CD may be more effective than either treatment alone.[22] Later stages with degenerative hip arthritis require femoral head replacement procedures such as hemiarthroplasty or hip replacement surgery.
POST-DECOMPRESSION IMAGING
Decompression involves drilling into necrotic bone to reduce intraosseous pressure, relieve the pain, and halt the natural progression of the disease. The main goal is to prevent articular surface collapse. Imaging studies following decompression typically show a reduction in BME, which correlates with clinical improvement in pain[9,13] [Figure 19a-d]. Post-procedural changes can continue for about 6 months after surgery;[23] hence, follow-up MR when needed may be performed after 6 months to assess for the disease progression. The area of osteonecrosis may show alteration in the signal intensity post-CD and may progress to a higher Mitchells MRI grade on imaging irrespective of improved pain relief in short-term follow-up[18] [Figure 20a-d].
- (a-d) Pre- and post-decompression imaging: (a) Coronal fluid sensitive short-tau inversion recovery (STIR) and (b) T2-weighted image (T2WI) magnetic resonance (MR) images of the right hip in a young man demonstrates osteonecrosis of the right femoral head (yellow arrow) with associated marrow edema (white arrow) and no significant collapse of articular surface. He underwent core decompression after a month of diagnosis. Follow-up MR was performed after 6 months. (c) Coronal fluid sensitive STIR and (d) T2WI MR images depict the linear impression of decompression along right femoral head-and-neck regions (thick yellow arrow). There is mildly reduced bone marrow edema and appearance of mild core sclerosis (yellow asterisk) with reduction in brightness of T2 signals when compared to pre-procedural images.
- (a-d) Pre- and post-decompression imaging: (a) Coronal fluid sensitive short-tau inversion recovery (STIR) and (b) T1-weighted image (T1WI) magnetic resonance (MR) images of the right hip in a young lady demonstrates osteonecrosis of femoral head (yellow arrow) with moderate-associated marrow edema (white arrow). She underwent core decompression. (c) Follow-up imaging with coronal fluid sensitive STIR and (d) T1WI MR images depict the linear impression of decompression along femoral head and neck regions (thick yellow arrow). There is markedly reduced bone marrow edema with mild core sclerosis (yellow asterisk) and marrow appearing less fatty compared to pre-procedural imaging.
BME with involvement of lateral part of weight-bearing aspect of the femoral head generally indicates a poor outcome after CD which may progress to head collapse. MRI is also crucial for evaluating potential complications post-procedure, such as infections, hematomas, or fractures [Figure 21a-f].
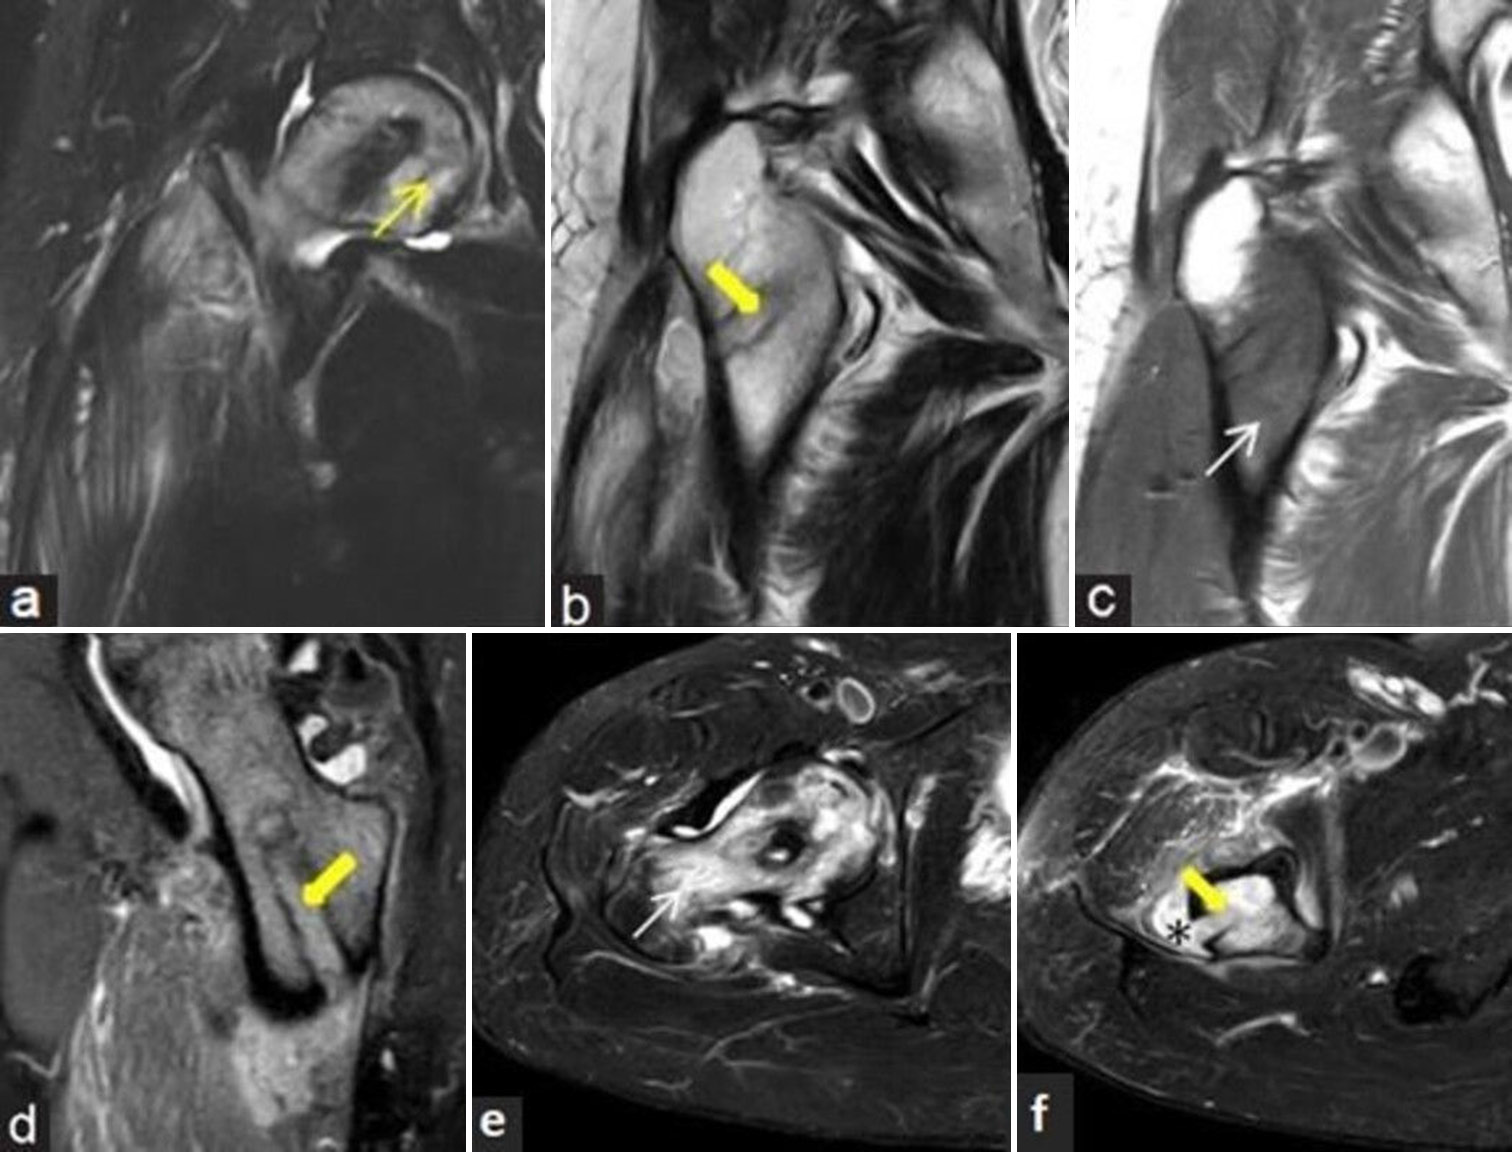
- (a-f) Post-decompression infection: 43-year man with prior decompression for the right femoral head osteonecrosis and recent increase in pain with fever. (a) Coronal fluid sensitive short-tau inversion recovery (STIR), (b) T2-weighted image, (c) T1-weighted magnetic resonance (MR) images and (d) T2 gradient echo (GRE) sagittal MR images of the right hip demonstrates osteonecrosis of femoral head (yellow arrow) with linear impression (thick yellow arrow) of decompression along femoral head and neck regions and surrounding bone marrow edema (white arrow in c). Small localized collection noted extending from the decompression tunnel into adjacent soft tissues with surrounding interstitial edema. (e and f) Axial fluid sensitive STIR images delineate the marrow edema (white arrow), linear impression of decompression (thick yellow arrow) and the tracking collection more strikingly (black asterisk). Presence of such extensive marrow edema, tracking soft-tissue collection and soft-tissue edema suggests infection.
DIFFERENTIALS OF AVN
Several conditions can clinically and radiologically mimic AVN of the hip, presenting with similar symptoms such as hip pain and the presence of BME on MRI. Accurate differentiation of AVN from its mimics is essential, as treatment options and prognoses vary. These conditions include stress injuries, BME syndrome, SIFs, as well as various infections and inflammatory causes [Figure 22a-d].
- (a-d) Avascular necrosis mimics. (a) Coronal short-tau inversion recovery (STIR) magnetic resonance (MR) image of the left proximal femur in 44-year lady shows marrow edema at head and neck regions with associated incomplete fracture line at medial aspect of neck, consistent with stress fracture (thick yellow arrow). (b) Sagittal STIR image of the left femur in a 52-year man shows marrow edema with low intensity subarticular line, consistent with subchondral insufficiency fracture (black arrow). (c) Coronal STIR MR image of the right hip in a 53-year man shows moderate diffuse bone marrow edema of the right femoral head in a case of bone marrow edema syndrome (white arrow). (d) Coronal STIR MR image of the right hip in a middle aged man shows arthritis changes (yellow asterisk) with moderate subarticular marrow edema with erosions at femoral head and acetabular margins with associated synovitis in a case of inflammatory arthritis.
-
Stress Injuries
These injuries can either be fatigue or insufficiency injuries and result from an imbalance between bone strength and prolonged mechanical loading, leading to conditions such as periostitis or fractures.[7] MRI is the preferred modality for diagnosing stress injuries, as it can reveal early-stage BME changes, particularly in the inferomedial femoral neck, acetabular roof, or femoral head, often accompanied by soft-tissue edema. In cases of continued stress or acute severe stress, fractures may develop, presenting as low-signal-intensity lines surrounded by BME. Differentiation from AVN is based on the specific location of marrow edema and the absence of the characteristic band seen in AVN.
-
Bone marrow edema syndrome
BME syndrome encompasses condition such as transient osteoporosis of the hip (TOH). It is the same phenomenon of stress injury without obvious fracture. It is typically observed in middle-aged individuals and women during the peripartum period, and it is often associated with extreme physical activity.
The syndrome presents with acute hip pain, which gradually resolves over a period of 6–9 months with appropriate rest, limited weight-bearing, and pain management. Recent studies have established that TOH is essentially a subchondral fracture, typically classified as an insufficiency fracture, although it may also present as a fatigue fracture in certain cases. In most instances, a distinct subchondral fracture line can be identified on high-resolution small field of view MRI, providing valuable diagnostic insight.[24]
MRI reveals intense BME in the femoral head within 48 hours of symptom onset. The BME may extend into the femoral neck, intertrochanteric, or subtrochanteric regions of the femur and is often accompanied by joint effusion. In some instances, fracture line may be apparent on follow-up MRI scans performed after 1–2 weeks. The edema on MRI classically resolves spontaneously on follow-up imaging on protected weight-bearing.
-
Subchondral insufficiency fracture
A SIF is defined as a fracture of the femoral head resulting from osteoporosis or osteopenia.[25] This is same phenomenon of the above two conditions, can be used interchangeably. Patients typically present with sudden, severe hip pain that does not improve with rest, and the condition may either resolve or progress to epiphyseal collapse. Conservative management is considered the first-line treatment, while surgical intervention is reserved for cases involving significant destruction of the femoral head.
MRI findings in SIF typically include joint effusion and extensive BME in the femoral head, neck, or acetabulum, along with a subchondral T1 hypointense fracture line. The fracture line in SIF is characterized as irregular, discontinuous, and convex toward the articular surface, reflecting both the fracture line and repair tissue.
In contrast, osteonecrosis presents with a smooth, low-intensity band that is concave toward the articular surface and nearly encircles the necrotic segment.
-
Infection and Inflammatory Causes of BME
BME of the femoral head can also result from infections or inflammatory conditions.[7]
In the early stages of infection, MRI may demonstrate synovial effusion, synovial hypertrophy, perisynovial and adjacent soft-tissue edema, as well as varying degrees of bone edema affecting both sides of the joint (the femoral head and acetabulum). Minimal areas of bone destruction or erosions may also be present.
AVN is characterized by the presence of a T1 hypointense band and the double-line sign on T2 or T2 fat-saturated images, which are not observed in infections. In addition, edema associated with infections typically involves both sides of the joint, whereas edema in the acetabulum is rare in AVN and may only be evident in later stages of the disease.
Inflammatory diseases such as rheumatoid arthritis and ankylosing spondylitis frequently affect the hip joint, with BME indicating active disease. BME may be observed in subchondral regions or around erosions and is closely associated with the degree of synovitis. Similar to infective arthritis, changes will be seen on both sides of the joint unlike in AVN where predominant findings are limited to the femoral head in the early stage.
LEARNING POINTS
AVN and bone infarcts, both result from ischemic bone death, differing only in location: AVN affects subchondral bone, while infarcts involve the medullary region.
Radiographic findings appear late and include patchy sclerosis or crescentic subchondral lucency at femoral head, articular surface collapse, and secondary osteoarthritis changes.
MRI findings summary: Geographic lesion at anterosuperior aspect, serpentine border, reactive interface line, double-line sign, and osteochondral fragmentation.
Prominent edema adjacent to infarct in the femoral head and neck, and hip joint effusion, suggests precollapse or impending articular collapse.
The degree of subchondral bone plate depression is a significant predictor of disease progression and potential collapse
Look beyond the head and neck of femur, for any osteonecrosis in other locations that may suggest multifocal osteonecrosis with systemic etiology.
Due to overlapping clinical presentations of osteonecrosis and lumbar spine disease, MRI hip screening in routine lumbar spine imaging is advisable.
While various classification systems exist, the key is to report findings that influence management decisions (Modified Ficat and Arlet commonly used, add quantification).
Always look for the opposite femoral head involvement.
CONCLUSION
MRI is the modality of choice for early diagnosis, evaluation, and staging of femoral head osteonecrosis. Detection in early stages helps initiate early therapeutic intervention to halt the natural progression of the disease. The location and extent of necrotic area on MRI predicts the risk of collapse. MRI is also used to monitor the treatment and predict the response to therapy. AI is being increasingly employed with deep learning methods like automatic segmentation for quantification of osteonecrosis. Perfusion MRI with dynamic contrast enhancement is a valuable tool to enable early detection of ischemic changes before structural damage becomes apparent on conventional MRI and aids in differentiating it from other causes of BME. While diffusion MRI can be useful for detecting early changes in osteonecrosis, it does have certain limitations that impact its ability to provide a definitive diagnosis and differentiate between disease stages or from other mimicking conditions.
Acknowledgments
Dr. Pushpa BT, Dr. Praveen K Chinnaiah, Dr. Hirak Chaudary, and Dr. Hurunnisa Begum for their valuable contributions to the article.
Ethical approval
Institutional Review Board approval is not required.
Declaration of patient consent
Patient’s consent not required as patients identity is not disclosed or compromised.
Conflicts of interest
There are no conflicts of interest.
Use of artificial intelligence (AI)-assisted technology for manuscript preparation
The authors confirm that there was no use of artificial intelligence (AI)-assisted technology for assisting in the writing or editing of the manuscript and no images were manipulated using AI.
Financial support and sponsorship: Nil.
References
- A case series on Covid-19 infection and avascular necrosis of hip. J Orthop Rep. 2023;2:100104.
- [CrossRef] [Google Scholar]
- Chemical shift and the double-line sign in MRI of early femoral avascular necrosis. J Comput Assist Tomogr. 1992;16:727-30.
- [CrossRef] [PubMed] [Google Scholar]
- Transient bone marrow edema syndrome versus osteonecrosis: perfusion patterns at dynamic contrast-enhanced MR imaging with high temporal resolution can allow differentiation. Radiology. 2017;283:478-85.
- [CrossRef] [PubMed] [Google Scholar]
- Magnetic resonance perfusion and diffusion imaging characteristics of transient bone marrow edema, avascular necrosis and subchondral insufficiency fractures of the proximal femur. Eur J Radiol. 2014;83:1862-9.
- [CrossRef] [PubMed] [Google Scholar]
- Imaging evaluation of patients with osteonecrosis of the femoral head. Curr Rev Musculoskelet Med. 2015;8:221-7.
- [CrossRef] [Google Scholar]
- A deep learning method for quantification of femoral head necrosis based on routine hip MRI for improved surgical decision making. J Pers Med. 2023;13:153.
- [CrossRef] [PubMed] [Google Scholar]
- MR imaging of the hip: An update on bone marrow edema. Semin Musculoskelet Radiol. 2019;23:276-88.
- [CrossRef] [PubMed] [Google Scholar]
- Correlation between bone marrow edema and collapse of the femoral head in steroid-induced osteonecrosis. AJR Am J Roentgenol. 2000;174:735-43.
- [CrossRef] [PubMed] [Google Scholar]
- Relationship between bone marrow edema and development of symptoms in patients with osteonecrosis of the femoral head. AJR Am J Roentgenol. 2006;186:1761-70.
- [CrossRef] [PubMed] [Google Scholar]
- A clinicopathologic study of transient osteoporosis of the hip. Skelet Radiol. 1999;28:621-7.
- [CrossRef] [PubMed] [Google Scholar]
- Is bone marrow edema syndrome a precursor of hip or knee osteonecrosis? Results of 49 patients and review of the literature. Diagn Interv Radiol. 2020;26:355-62.
- [CrossRef] [PubMed] [Google Scholar]
- Systematic analysis of classification systems for osteonecrosis of the femoral head. J Bone Joint Surg Am. 2006;88(Suppl 3):16-26.
- [CrossRef] [PubMed] [Google Scholar]
- Which classification system is most useful for classifying osteonecrosis of the femoral head? Clin Orthop Relat Res. 2018;476:1240-9.
- [CrossRef] [PubMed] [Google Scholar]
- Classification of osteonecrosis of the femoral head: Who should have surgery? Bone Joint Res. 2019;8:451-8.
- [CrossRef] [PubMed] [Google Scholar]
- Prediction of collapse in femoral head osteonecrosis: A modified Kerboul method with use of magnetic resonance images. J Bone Joint Surg Am. 2006;88(Suppl 3):35-40.
- [CrossRef] [PubMed] [Google Scholar]
- Quantifying the extent of femoral head involvement in osteonecrosis. J Bone Joint Surg. 2003;85:309-15.
- [CrossRef] [PubMed] [Google Scholar]
- Spontaneous resolution of osteonecrosis of the femoral head. J Bone Joint Surg Am. 2004;86:2594-9.
- [CrossRef] [PubMed] [Google Scholar]
- MRI evaluation of post core decompression changes in avascular necrosis of hip. J Clin Diagn Res. 2015;9:TC04-8.
- [CrossRef] [PubMed] [Google Scholar]
- Free vascularised fibular grafts in orthopaedics. Int Orthop. 2014;38:1277-82.
- [CrossRef] [PubMed] [Google Scholar]
- Mid-to long-term results of modified avascular fibular grafting for ONFH. J Hip Preserv Surg. 2021;8:274-81.
- [CrossRef] [PubMed] [Google Scholar]
- Magnetic resonance imaging criteria of successful core decompression in avascular necrosis of the hip. Skeletal Radiol. 2004;33:519-23.
- [CrossRef] [PubMed] [Google Scholar]
- The efficacy of bisphosphonates with core decompression and mesenchymal stem cells compared with bisphosphonates alone in the treatment of osteonecrosis of the hip: A retrospective study. HSS J. 2016;12:137-44.
- [CrossRef] [PubMed] [Google Scholar]
- Prediction of collapse with magnetic resonance imaging of avascular necrosis of the femoral head. J Bone Joint Surg Am. 1994;76:215-23.
- [CrossRef] [PubMed] [Google Scholar]
- Presence of subchondral fracture in cases diagnosed as transient osteoporosis of the hip: A retrospective independent reader-based study. Skeletal Radiol. 2024;53:871-9.
- [CrossRef] [PubMed] [Google Scholar]
- Current research on subchondral insufficiency fracture of the femoral head. Clin Orthop Surg. 2022;14:477-7.
- [CrossRef] [PubMed] [Google Scholar]


