
Translate this page into:
Femoroacetabular impingement, labral tears, mimics, and ischiofemoral impingement – A comprehensive imaging review
 , Surendra Kumar Bugata5, Raj Chari6

*Corresponding author: Sonali Sethi, Department of Radiology, Sakra World Hospital, Bengaluru, Karnataka, India. sonali.radio@gmail.com
-
Received: ,
Accepted: ,
How to cite this article: Sethi S, Narayanaswamy S, Shah AJ, Spalkit S, Bugata SK, Chari B. Femoroacetabular impingement, labral tears, mimics, and ischiofemoral impingement – A comprehensive imaging review. 2025;7:94-107. doi: 10.25259/IJMSR_65_2024
Abstract
Femoroacetabular impingement has been described as a distinct clinical entity in the past two decades, and the pathomechanics and imaging findings have been extensively studied in detail. Since it is considered as a major preventable cause of early osteoarthritis in the young population, it is imperative to diagnose this early to prevent irreversible cartilage and labral changes and early joint replacement. This article aims to revisit the imaging findings on radiography, computed tomography scan, and magnetic resonance (MR) imaging for accurate and early diagnosis. The technique for performing and interpretation of MR arthrograms and labral pathology in the context of impingement will be discussed, along with labral variants mimicking pathology. Ischiofemoral impingement and its pathomechanics and imaging will also be discussed.
Keywords
Acetabular labrum
Femoroacetabular impingement
Ischiofemoral impingement
Labral tear

INTRODUCTION
Femoroacetabular impingement (FAI) has been described as an early premature contact of the femoral head-neck junction with the acetabulum due to either (or a combination of) an abnormal morphology of the femoral head neck junction, acetabulum, or due to supraphysiological extreme range of motion, especially in internal rotation and flexion as in ballet dancers or gymnasts.[1]
The morphological features of FAI and labral injuries may be seen in asymptomatic patients; however, it is clinically relevant when the imaging findings are seen in the presence of signs and symptoms of the disease.[2]
Five elements of FAI, namely, abnormal morphology, abnormal contact, supraphysiological motion, continuous insult with repetitive motion, and soft-tissue damage, have been described by Sankar et al.[3] In accordance with the Warwick agreement, FAI syndrome is defined as a triad of symptoms, clinical signs, and imaging findings.[4]
The clinical symptoms are groin, buttock, back, or thigh pain, which can vary in severity. It may be related to movement or may occur after a prolonged sitting. Reduced range of motion might precede these symptoms. Hip impingement test – flexion, adduction, and internal rotation reproduce patient’s typical pain.[5]
Identification of CAM and Pincer morphology should be done on imaging, beginning with an anteroposterior (AP) radiograph of the hip and lateral femoral neck view. If radiographs are suggestive, they should be combined with cross-sectional imaging for an early and accurate diagnosis. This will help better characterize the morphology, detect chondral and labral lesions, and plan for surgery.[4]
MORPHOLOGY AND PATHOMECHANICS OF CAM AND PINCER MORPHOLOGY OF FAI
Pincer type of FAI
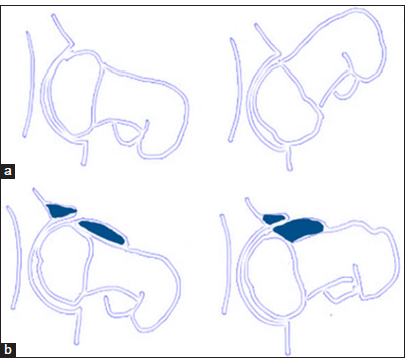
Morphological abnormality on the acetabular side has been described as the pincer type of FAI. It is defined as an acetabular over-coverage that leads to impingement during flexion [Figure 1].
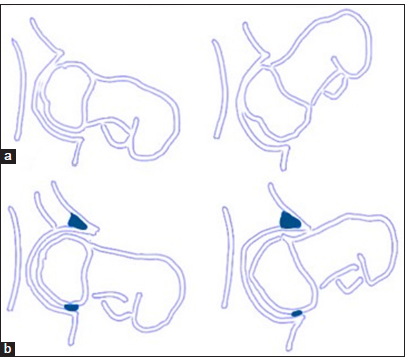
- (a) Schematic diagram of a normal hip in flexion showing unrestricted range of motion in flexion. (b) Schematic diagram of a hip with acetabular over-coverage causes premature contact of the femoral head-neck junction and acetabular rim leading to labral and cartilage damage. Posterior subluxations cause counter coup lesions at the posterior-inferior labrum.
Repeated microtrauma results in a primary labral injury, as the labrum is crushed between anterior acetabular rim and femoral head-neck junction. In the initial stages, it is seen as labral bruising, it then progresses to labral tear followed by chondral damage adjacent to the labral tear [Figure 2].
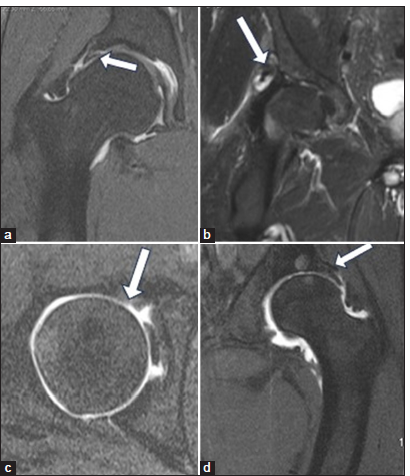
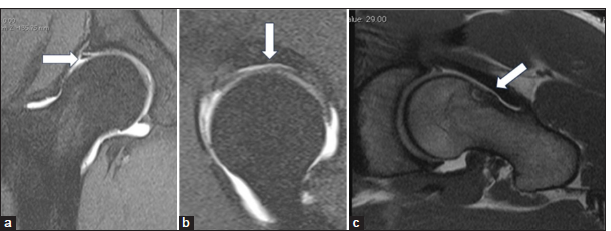
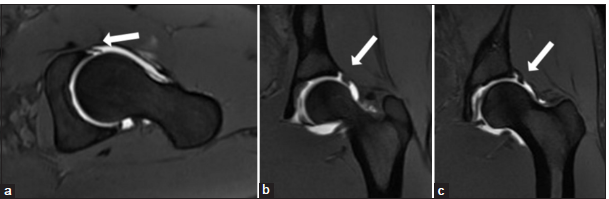
- (a) Magnetic resonance (MR) arthrogram coronal T1 fat-saturated image in a 42-year-old female with pincer type of femoroacetabular impingement (FAI) showing a superior labral tear with the contrast extending within the labral substance to >50% of the substance indicating a tear (white arrow). (b) MR coronal proton-density fat-saturated image in a 38-year-old female with pincer type of FAI showing an extensive superior labral tear with labral distortion and associated paralabral cyst formation (white arrow). (c) MR arthrogram axial T1 fat-saturated in a 45-year-old female with pincer type of FAI showing early cartilage damage at the anterosuperior quadrant (white arrow). (d) MR coronal T1 fat-saturated in a 38-year-old female with pincer type of FAI showing lateral weight-bearing acetabular chondral damage (white arrow).
A countercoup injury occurs to the posterior-inferior labrum in advanced cases as there is posterior subluxation of the femoral head due to increased pressure within the joint. In advanced cases, there is ossification of the labral rim[1] [Figure 3].
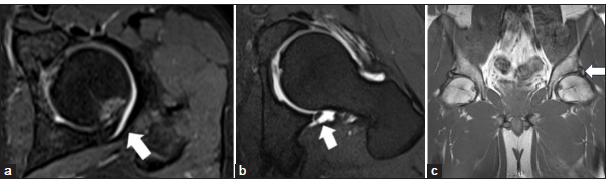
- (a) Magnetic resonance (MR) T1 fat-saturated arthrogram axial image showing posterior over-coverage leading to posterior impingement in a 40-year-old male patient. Cartilage damage and bone marrow edema with cortical depression is seen at the posterior aspect (white arrow). (b) MR T1 fat-saturated arthrogram axial image showing posteroinferior labral tear as a part of counter coup lesion in a case of pincer impingement in a 35-year-old male patient (white arrow). (c) MR T1-weighted coronal images showing heterotopic ossification at the labral margins called os acetabuli leading to acetabular over-coverage and contributing to pincer type impingement (white arrow).
CAM type of FAI
Morphological abnormality on the femoral side has been described as CAM type of FAI. It refers to abnormal morphology of the femoral head-and-neck junction, with an osseous or cartilaginous bump at the femoral neck causing shearing forces, and repetitive contact causes damage to the chondrolabral junction [Figure 4]. Progressive damage causes chondral delamination (carpet sign), preceding which is a pre-delaminating injury (wave sign).[1] Synovial herniation pits are seen at the femoral head neck junction [Figure 5].
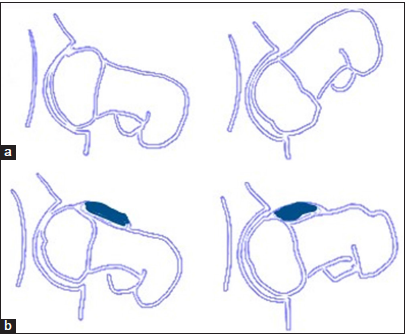
- (a) Schematic diagram of a normal hip in flexion showing unrestricted range of motion in flexion. (b) Schematic diagram of Coxa Magna impingement showing an osseous bump at the femoral head and neck junction which causes shearing injury to the acetabular labrum and cartilage on hip flexion.
- (a) Coronal proton density fat saturated images in a case of Coxa Magna impingement in a 30-year-old male patient with labral-cartilage junction injury (white arrow). (b) Sagittal magnetic resonance arthrogram image showing cartilage delamination injury to the superior labrum between 1 and 11 o’ clock position. (c) T1 axial images showing synovial herniation pit at the femoral head and neck junction (white arrow in a-c).
The most common clinical presentation, however, is the mixed type of FAI, which is a combination of pincer and CAM morphology [Figure 6].
- (a) Schematic diagram of a normal hip in flexion showing unrestricted range of motion in flexion. (b) Schematic diagram of mixed impingement. Acetabular over-coverage causes premature contact of the femoral head-neck junction and acetabular rim leading to labral and cartilage damage. The osseous bump at the femoral head-and-neck junction causes shearing injury to the acetabular labrum and cartilage.
RADIOGRAPHIC ASSESSMENT OF FAI
Technique and views
The AP pelvic view and an axial cross-table view of the proximal femur are the standard imaging views for the diagnosis of FAI. A Dunn/Rippstein view is an alternative done in 90° of flexion or a modified Dunn view in 45° of flexion can be used.[5]
The AP view is obtained in a supine patient with a beam directed to the mid-point of the line connecting the anterosuperior iliac spines to the superior border of the symphysis pubis. The film-focus distance is 1.2 m, and the legs are internally rotated to 15° to compensate for the femoral ante-torsion[5] [Figure 7]. An adequate true AP radiograph should have a neutral pelvic tilt defined as the sacrococcygeal joint within 3.2 cm of the symphysis for men or 4.7 cm for women and a neutral rotation of <5 mm [Figure 8].
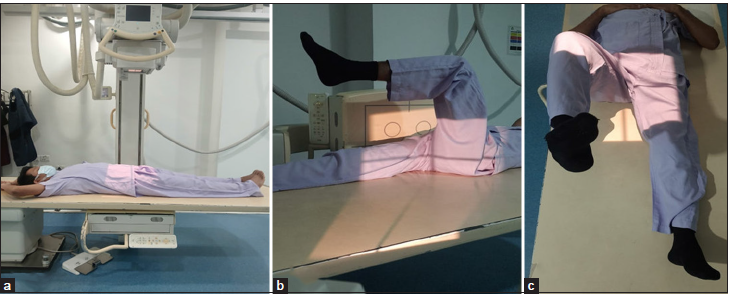
- (a) Radiographic positioning for anteroposterior pelvic view is obtained in 15° of internal rotation and heels placed 20–24 cm apart. The central beam is directed mid-way between the anterior superior iliac spine (ASIS) and pubic symphysis, about 5 cm inferior to ASIS and 5 cm superior to pubic symphysis. (b) Radiographic positioning for the cross-table lateral view. The lower extremity is internally rotated to 15° in a supine position and the hip and knee joints on the other side are flexed. A cassette is positioned on the side of the hip at the right angle relative to the incidence angle, thereby projecting toward the groin region at 35–45° of incidence parallel to the longitudinal axis of the femur. (c) Radiographic positioning for the Dunn view. The symptomatic hip joint is flexed to 90° or 45°. Beam is centered to the midpoint between the ASIS and pubic symphysis.
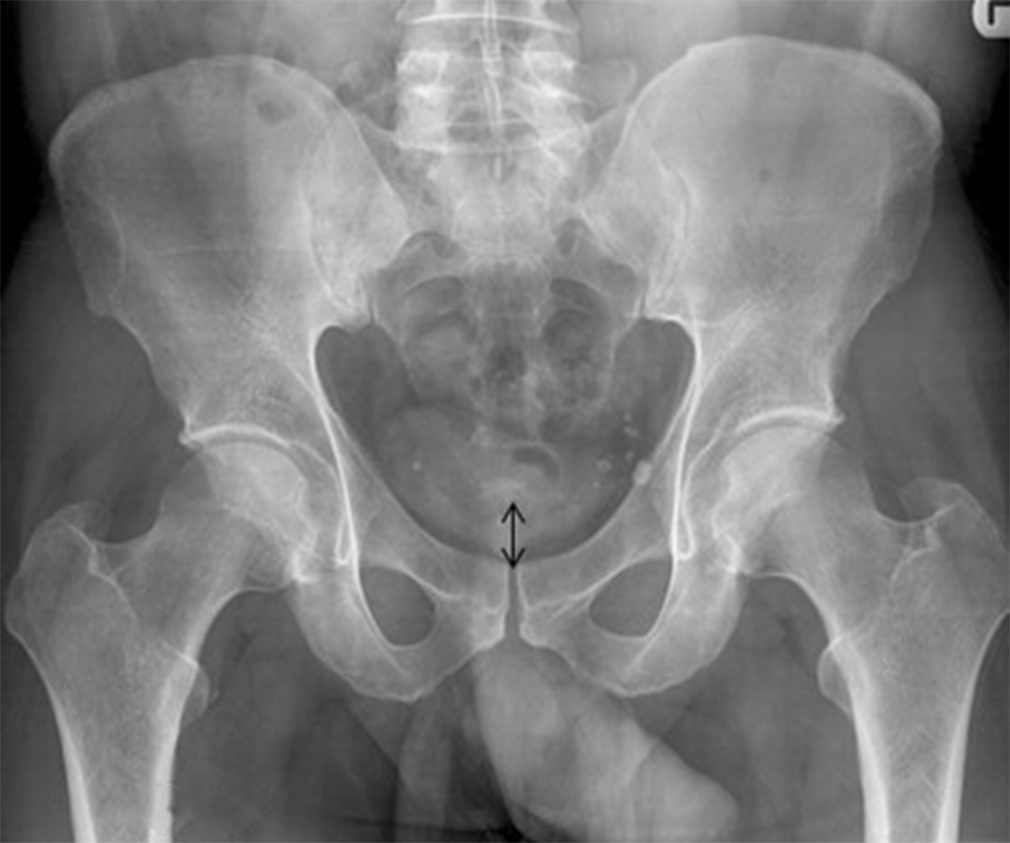
- Anteroposterior radiograph: Defining a Neutral pelvic tilt, The sacrococcygeal joint with in 3.2 cms of the symphysis for men or 4.7 cms for women- black arrow. Neutral rotation <5mm.
Similarly, in the cross-table view, the proximal leg is internally rotated, and central beam is directed to the inguinal fold with a film to focus distance of 1.2 m[5] [Figure 7].
The 90 and 45° Dunn views are performed by flexing the hip to 90° and 45°, respectively, and obtaining the X-ray with a beam directed similarly to the AP radiograph [Figure 7].
RADIOGRAPHIC SIGNS OF PINCER FAI
Increased acetabular depth is seen in coxa profunda and protrusion acetabuli. In a normal hip, the acetabular fossa line lies lateral to the ilioischial line. In coxa profunda, the floor of the acetabular fossa either overlaps or is medial to the ilioischial line and in protrusio acetabuli the femoral head either overlaps or is seen medial to the ilioischial line[5,6] [Figure 9].
- (a) Anteroposterior (AP) radiograph of the right hip joint in a 40-year-old individual showing normal relationship of the floor of the acetabular fossa and the ilioischial line. (b) AP radiograph of the right hip in a 42-year-old male with coxa profunda showing the acetabular fossa medial to the ilioischial line. (c) AP radiograph of the right hip joint in a 48-year-old male patient with protrusio acetabuli showing abnormal medial relationship of the acetabular fossa with the ilioischial line.
The lateral center edge angle measures the angle between the line joining center of femoral head to the lateral edge of the acetabulum and the vertical line. An angle of more than 39° signifies over-coverage[5,6] [Figure 10].
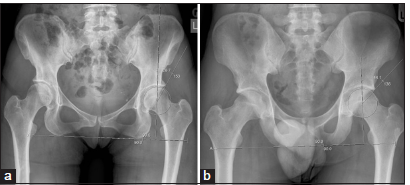
- (a) Anteroposterior radiograph in a 40-year-old female patient showing a normal lateral center edge angle which measures the angle between center of femoral head and the lateral edge of the acetabulum. (b) Anteroposterior radiograph in a 35-year-old male patient showing acetabular over-coverage. An angle more than 39° signifies over-coverage. In this patient, the angle measures 44.1°.
The acetabular roof angle is formed between the center of sclerotic zone of femoral head and the lateral center of the acetabulum and is zero or even negative in over-coverage[5,6] [Figure 11].
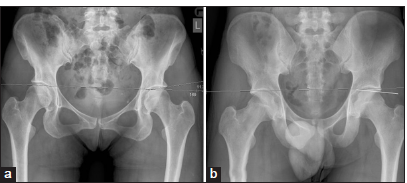
- (a) Normal acetabular roof angle in a 25-year-old female patient. The acetabular roof angle is formed between the horizontal plane of the pelvis and a line between the medial edge of acetabular sourcil to the lateral most part of the sourcil. (b) The acetabular angle is zero or even negative in over-coverage as in this case of a 35-year-old male patient with excessive acetabular over-coverage.
The femoral head extrusion index reflects the percentage of the femoral head, which is uncovered and is measured by dividing the distance of the lateral femoral head, which is uncovered, by the width of the femoral head. A normal extrusion index is between 17–27%, and <17% signifies acetabular over-coverage.[7]
Cross-over sign or the anterior rim sign reflects anterior over-coverage or anterior focal acetabular retroversion and is defined as the anterior rim line being projected lateral to the posterior rim line at the cranial aspect and crossing medial to it distally, in a figure of 8 configuration[8] [Figure 12].
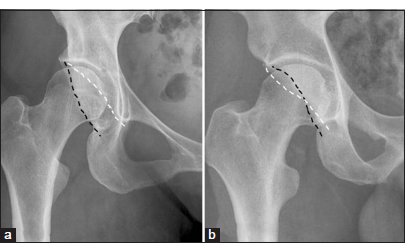
- (a) Normal relationship of the anterior (white dotted line) and posterior rim lines (black dotted line) on a right hip anteroposterior radiograph in a 30-year-old male. (b) Cross-over sign or the anterior rim sign, on a anteroposterior radiograph in a 30-year-old male reflects anterior over-coverage or anterior focal acetabular retroversion and is defined as anterior rim line (white dotted line) being projected lateral to the posterior rim line (black dotted line) at the cranial aspect and crossing medial to it distally, in figure of 8 configuration.
The posterior wall sign is defined as a more prominent posterior wall such that the posterior line lies lateral to the femoral center, in contrast to a normal hip where the posterior rim lies at approximately the center of the femoral head[8] [Figure 13].
- (a) Normal relationship of the posterior rim line on a left hip anteroposterior radiograph in a 30-year-old male. The posterior rim lies at approximately the center of the femoral head or slightly medial (circle). (b) Posterior wall sign is a more prominent posterior wall such that the posterior line lies lateral to the femoral center (circle).
RADIOGRAPHIC SIGNS OF CAM FAI
Pistol grip deformity is the osseous bump along the anterosuperior or lateral femoral head-neck junction, which resembles a handle of a pistol due to the loss of the normal femoral head-neck junction concavity[5] [Figure 14].
- Pistol grip deformity is seen as an osseous bump along the anterosuperior or lateral femoral head-neck junction, which resembles a handle of a pistol due to loss of the normal femoral head neck junction concavity (circle). An anteroposterior radiograph in a 30-year-old male showing the characteristic osseous bump at the femoral head neck junction.
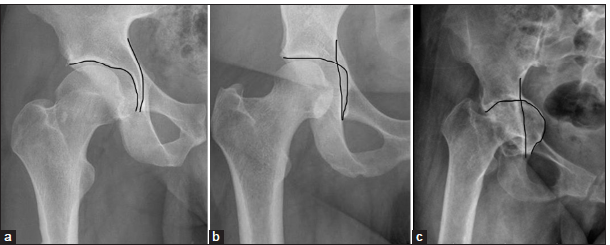
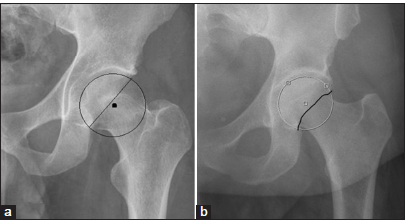
Non-spherical femoral head is called femoral head asphericity and is quantified by the α angle and femoral offset. The alpha angle is measured as an angle between the line connecting the femoral head center with the point of beginning of asphericity and the femoral neck axis. An abnormal alpha angle is defined as more than 55°[5,9] [Figure 15].
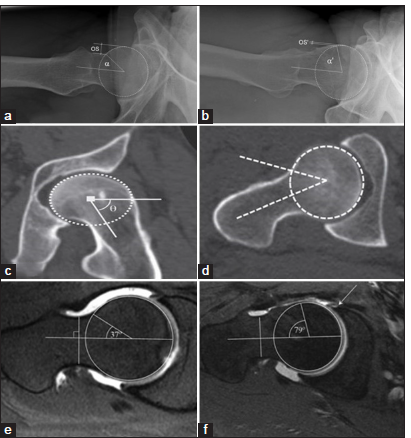
- (a) A lateral radiograph showing a normal alpha angle and femoral offset (OS) in a 30-year-old. A circle is drawn around the femoral head (white circle). (b) Abnormally increased alpha angle and reduced femoral offset on a lateral radiograph in a 35-year-old male with Coxa Magna deformity showing a non-spherical femoral head called femoral head asphericity. The alpha angle is measured as an angle between the femoral neck axis and a line connecting the femoral head center with the point of beginning asphericity. An alpha angle >55° is abnormal. Further, there is reduced femoral offset. Circle is drawn around the femoral head (white dotted circle) (c) A 35-year-old male with CAM deformity showing a non-spherical femoral head called femoral head asphericity on a coronal oblique reconstructed non-contrast computed tomography (CT) scan and an abnormal alpha angle (>55°). Circle is drawn around the femoral head (white dotted circle). (d) Axial non-contrast CT scan in a patient with CAM deformity showing femoral head a-sphericity with an abnormal alpha angle (>55°). (e) A 35-year-old male patient showing normal alpha angle on the oblique axial proton density fat saturated (PDFS) images. (f) An abnormal alpha angle (>55°) on an oblique axial PDFS magnetic resonance imaging image in a 36-year-old male patient with associated tear at the anterior labral at the labrocartilagenous junction.
The anterior femoral offset is defined as the difference in radius between the anterior femoral neck and the anterior femoral head on a cross-table axial view of the proximal femur, and cutoff for the anterior femoral offset is 7.2 ± 0.7 mm for diagnosis of a CAM impingement[10] [Figure 16].
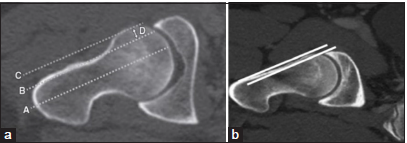
- (a) Normal anterior femoral offset in a 30-year-old male patient defined as the difference in radius between the anterior femoral neck and anterior femoral head of the proximal femur and cutoff for the anterior femoral offset is 7.2 ± 0.7 mm for diagnosis of a Coxa Magna impingement on an oblique axial computed tomography (CT) scan. Line A is drawn along the femoral head neck axis. Lined B is drawn parallel to line a through the edge of the femoral neck. Line C is drawn parallel to line A through the edge of the femoral head. Line D is distance between line B & C and reflects the anterior femoral offset. (b) Significantly reduced anterior femoral offset in a 38-year-old male patient with CAM deformity on an oblique axial view CT scan.
Femoral ante-version
Reduced femoral ante-version leads to impaction on the anterior rim of acetabulum during internal rotation, and increased femoral ante-version leads to impaction on the posterior rim during external rotation. It is increased in pincer impingement compared with cam-type impingement, resulting in the classical posteroinferior rim lesions.[6,11] It can be measured by obtaining rapid axial sequences through the femoral neck as well as the condyles and is calculated as a difference in angles between the femoral neck and horizontal and femoral condyles and a horizontal [Figure 17]. Coxa vara or reduced femoral head shaft angle is associated with CAM impingement [Figure 17].
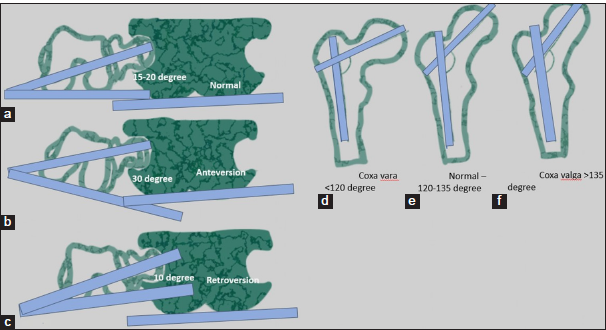
- (a) A schematic representation normal angle of anteversion defined as angle between a line connecting the femoral condyles and another line connecting the femoral head and neck. (b) Schematic representation of increased femoral neck shaft angle in increased anteversion. (c) Reduced femoral anteversion angle is referred to as femoral retroversion. (d) Schematic representation of reduced femoral head shaft angle in coxa vara. (e) Schematic representation of normal femoral head shaft angle. (f) Schematic representation of increased femoral head shaft angle in coxa valga. Femoral ante-version and femoral coxa vara are associated with CAM type femoroacetabular impingement.
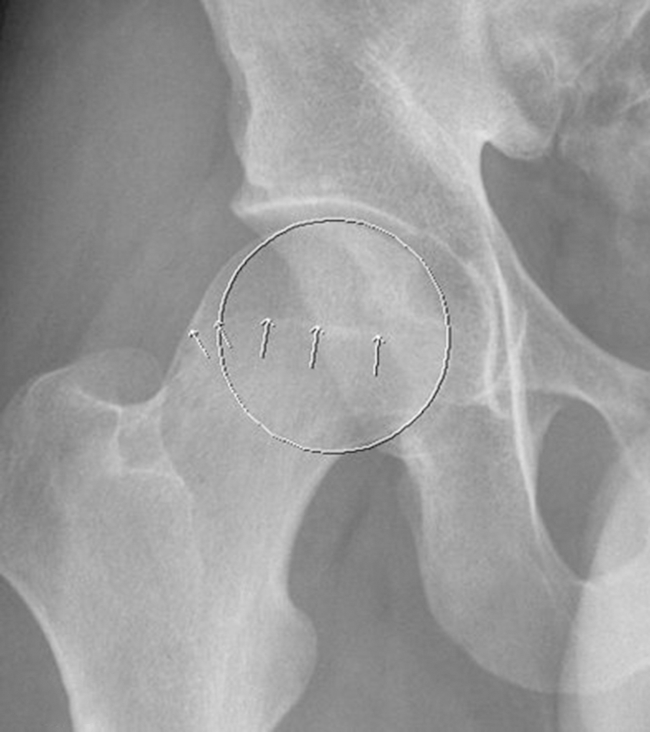
Secondary radiographic changes are seen as acetabular rim lesions, reactive ossification, labral ossicles, and Os. acetabulum in pincer impingement. Synovial herniation pits are seen as radio-lucencies at the femoral neck at the anterior proximal superior quadrant and are frequently seen in CAM impingement, though not specific for it[12] [Figures 5 and 18].
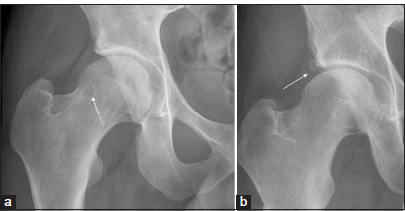
- (a) Secondary signs of femoroacetabular impingement (FAI) on radiograph femoral head-and-neck junction cyst in a 35-year-old male patient with CAM impingement (white thin arrow). (b) Secondary signs of FAI on radiograph: An acetabular labral ossicle in a 40-year-old female patient with pincer impingement (white thin arrow).
COMPUTED TOMOGRAPHY (CT) IMAGING IN FAI
All the radiographic findings mentioned above can be assessed on CT scans as there is an excellent evaluation of osseous anatomy on CT scans and helpful for assessment of peri-labral calcifications, fractures, surgical changes, and coexisting anterior inferior iliac spine impingement. However, it has limited soft-tissue contrast resolution, and hence, limited evaluation of the labrocartilage complex is possible. Axial slices through the femoral condyles can be used to assess the femoral torsion.
MAGNETIC RESONANCE IMAGING (MRI) AND MAGNETIC RESONANCE (MR) ARTHROGRAM IN EVALUATION OF FAI
The primary pathology in impingement is damage to the acetabular labrum and cartilage. It is challenging to image these structures as they are very small and require low field of view and high-resolution MRI for depiction. The surgical management is based on cartilage changes, and the femoral and acetabular cartilage cannot be separated, so minor damage is difficult to assess despite an intra-articular contrast.[13]
MRI performed at 1.5–3T is moderately sensitive and specific (sensitivity 66% and specificity 79%) for the diagnosis of labral tears. MR arthrogram has a higher sensitivity and moderate specificity (sensitivity 87% and specificity 64%) and a higher diagnostic accuracy.[13] MR arthrogram is preferred in inconclusive labral tears, post-operative labrum and for assessment of labrocartilage defects where it ranks more superior to the MRI.[14]
TECHNIQUE FOR MR ARTHROGRAM
The patient is placed supine on the fluoroscopic table with the leg in slight internal rotation. After skin disinfection, using a 22G needle, 4 mL of 2% lidocaine is used for local anesthesia, and the same needle is directed obliquely from the intertrochanteric line toward the femoral neck junction. Once the capsule is punctured, there is a feeling of give way, and intra-articular position is confirmed using a small amount of iodinated contrast material. A cocktail of 4 mL of iodinated contrast, 12 mL of 0.9% saline solution, 4 mL of bupivacaine, and 0.1 mL of Gadolinium (Dilution 1 in 200) is prepared. About 10 mL of the diluted gadolinium is injected, and an MRI is obtained within half an hour of the injection[15] [Figure 19].
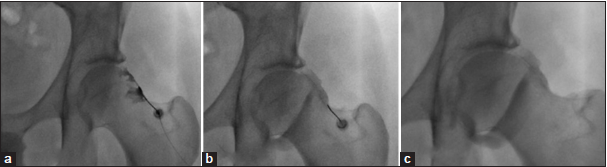
- (a-c) Fluoroscopy-guided sequential hip arthrogram images as a preparation for magnetic resonance arthrogram in a 40-year-old male patient showing accurate needle placement at the femoral head-and-neck junction laterally, subsequent distention of the joint capsule with contrast agent and a band like zona orbicularis/annular ligament at the head neck junction.
The sequences used for MRI in our institution are a combination of T1 and PD sequences, including axial obliqueT1 FS, Cor T1, Cor PDFS, Axial Oblique PDFS, Sag T1FS, and radial sequences. Oblique axial images allow for accurate measurement of the alpha angle.
NEWER CARTILAGE IMAGING TECHNIQUES IN FAI
The FAI trial study is a multi-center study, which has recommended clinical management of the FAI, and proved that early arthroscopic surgery is superior to conservative measures such as activity modification and physiotherapy. The patients were followed for 38 months based on symptoms, imaging, and urine and serum for markers of cartilage metabolism.[16] The MRI protocol for this study included a T2 mapping for quantification of collagen orientation and T1 Rho sequences for assessing the abnormal proteoglycan biochemical composition of the cartilage. These sequences are useful for the assessment of early cartilage loss.
Delayed gadolinium-enhanced MRI of cartilage is another newer technique for the evaluation of the glycosaminoglycan content in articular cartilage.[17]
NORMAL LABRUM ON MRI
A normal labrum appears triangular (66–69%) and shows diffuse low-signal intensity on all MRI sequences. It may, however, vary in signal and shape. An intrinsic signal may be due to mucoid degeneration, vascular markings, or artifactually due to the magic angle effect [Figure 20]. Less commonly round and flat shapes have been reported as well. Labrum is attached to the articular cartilage and the bony acetabulum at the chondrolabral and osseolabral junctions. A zone of calcified cartilage bridges the osseolabral junction.[18] The labrum measures 2–3 mm and is wider and thinner anteriorly and thicker posteriorly. It is deficient anteroinferiorly and posteroinferiorly and is bridged by the transverse acetabular ligament.[19]
- T1 fat-suppressed magnetic resonance arthrogram coronal image in a 30-year-old female patient showing a normal labral anatomy. The labrum is elongated, triangular in shape and is showing a slight hyperintense signal which is normal (white arrow).
LABRAL PATHOLOGY ON MRI AND MR ARTHROGRAMS
A labral degeneration is seen as increased intrasubstance signal intensity, swelling, and fraying of the surface.
Labral tears seen predominantly in the pincer type of impingement are seen as an irregular hyperintense signal within the labral substance, surfacing the articular or capsular substance.[17] Labral ossification is associated with a pincer labral lesion and needs to be accurately reported for surgical planning.
Chondrolabral separation pattern seen predominantly in CAM impingement is seen as increased signal intensity or contrast material undercutting the chondrolabral or osseolabral junction.[17] Initially, the lesion is seen at the chondrolabral junction, and further progression causes peripheral extension toward the capsule, leading to osseolabral detachment or complete labral separation.[18] The indirect signs of labral tear are labral displacement, distortion, and absence.[18] Encapsulation of leaked synovial fluid through the labral defect forms paralabral cysts. In many cases, the labral tear itself is occult, and the only sign is the presence of a paralabral cyst or adjacent cartilage damage.[19]
The labral tears are mostly seen in the anterosuperior quadrant. Dysplastic hips and posterior dislocations show tears in the posterior superior quadrants and posteroinferior labral tears in counter-coup lesions in pincer impingement.[20]
CLASSIFICATION OF LABRAL TEARS
There are several classifications of labral tears based on the arthroscopic and MR arthrograms. A summary of these systems is provided in the following Table 1.[18-24]
| Name of classification system | Type of classification | Type 1 | Type 2 | Type 3 | Type 4 |
|---|---|---|---|---|---|
| Lage et al.[18] [Figure 21] | Arthroscopic Morphology | Flap tear | Radial fibrillated | Peripheral Longitudinal | Unstable, thick and distorted. |
| Beck et al.[19] | Arthroscopic Classification | Degeneration | Chondrolabral separation | Complete labral avulsion | Labral ossification |
| Czerny et al.[20] [Figure 22] | MRI Classification |
|
|
|
- |
| Seldes et al.[21] | Classification on cadaveric study | Labral detachment of the transition zone of the fibrocartilaginous and articular hyaline cartilage | Labral substance tears | - | - |
| Blankenbaker and Tuite[22] [Figure 23] | MR arthrogram Classification based on tear morphology and clock face position | Frayed | Flap tear | Acetabular detachment | Unstable |
| Yoon et al.[23] | MRI classification in hip dysplasia | Fraying and blistering at chondrolabral junction. | Labral tear with chondrolabral junction disruption | Non-displaced chondrolabral and capsulolabral junction disruption. | Displaced labrum |
| Elnahal WA et al.[24] | MRI classification to predict type of arthroscopic surgery | Stable tears with intrasubstance degeneration-no surgery is needed | Unstable complete tears -needing labral repair | Unstable intrasubstance tears- needing labral debridement |
MRI: Magnetic resonance imaging, MR: Magnetic resonance
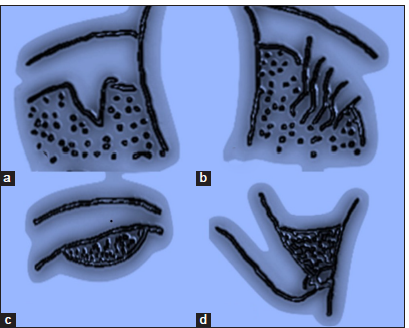
- Schematic diagram showing the Lage classification of labral tears: (a) Type 1 damage to the free margin of the labrum results in flap formation. Schematic image of a radial flap tear. (b) Type 2 showing a radial fibrillated tear which occurs due to degenerated labrum resulting in a fibrillated appearance of the labral surface. (c) Type 3 tear as a peripheral longitudinal tear is seen at the junction of acetabulum and labrum. (d) Type 4 tear seen as an unstable labral tear caused by labral subluxation and dysfunction.
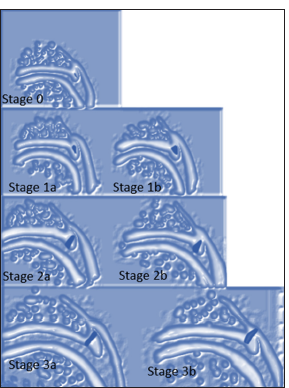
- Schematic diagram of Czerny classification of labral tears. STAGE 0-Normal labrum without signal or degeneration appears, triangular and continuous and the perilabral recess is present. STAGE 1a-represents intrasubstance degeneration, the labrum is triangular, and the perilabral recess is present. STAGE 1b-increased intrasubstance labral signal with a thick deformed labrum and the perilabral recess is absent. STAGE 2a-represents a labral tear without labral detachment. STAGE 2b-represents a labral tear without labral detachment with a thick deformed labrum and the perilabral recess is absent. STAGE 3a-represents a labral detachment. STAGE 3b-represents a labral detachment with a thick deformed labrum and the peri-labral recess is absent.
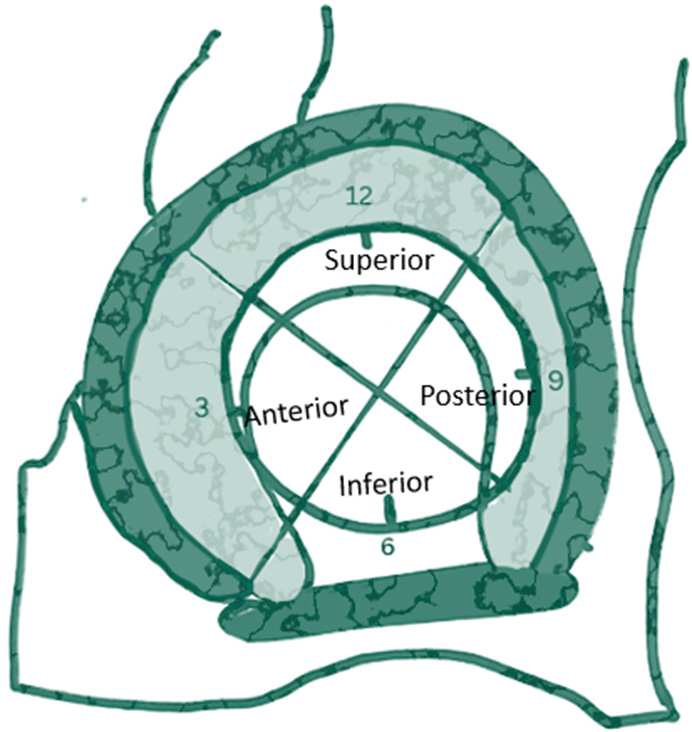
- Schematic diagram showing labral tear description according to the quadrants and clock face view according to Blakenbaker’s classification. The acetabular labrum is divided into four quadrants with the superior, anterior and posterior labrum labeled as 12 o’clock, 3 o’clock, and 9 o’clock, respectively. The acetabular labrum is deficient inferiorly and is bridged by the transverse ligament with the midportion labeled as 6 o’clock.
Labral tear mimics
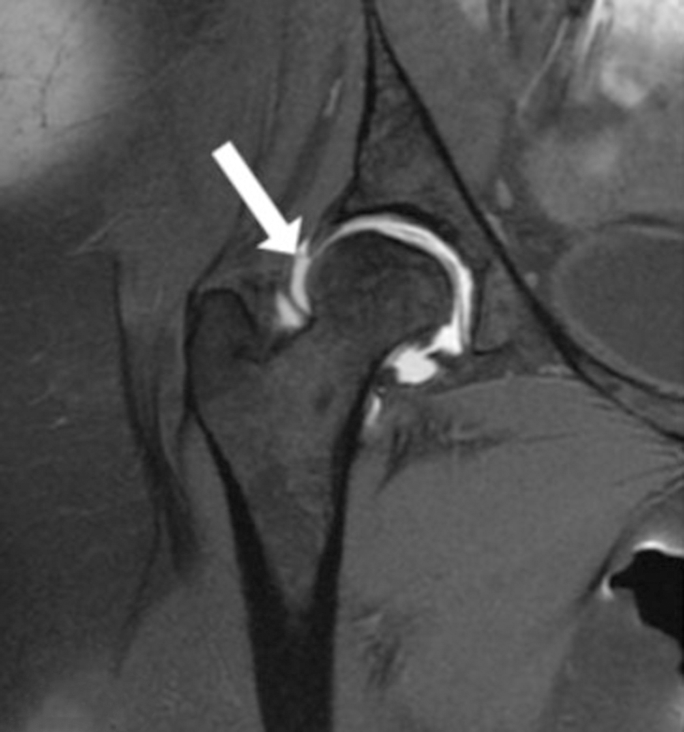
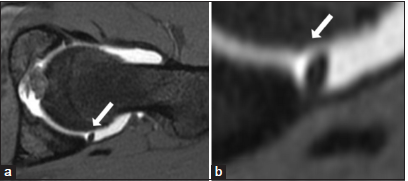
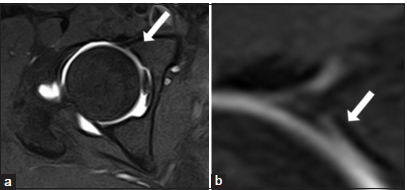
Peri-labral sulcus, labrum-transverse ligament, and sublabral sulci might be confused with a labral tear; it is important to distinguish these from labral tears. A labral tear is most commonly located at the anterosuperior aspect, has irregular edges, and extends through more than 50% of the substance thickness[24,25] [Figure 24]. Associated paralabral cysts and adjacent cartilage changes help in making the distinction. A sub-labral sulcus, however, is more common posterior-inferiorly, has smooth margins, less than half of the width of the labral substance, and perilabral abnormalities are not seen. A posteroinferior labral tear is extremely uncommon, except in dysplasia and hip dislocation, and this position favors a sublabral sulcus [Figure 25].
- (a-c) T1 fat-suppressed magnetic resonance arthrogram axial and coronal images in a 30-year-old female patient: A characteristic labral tear with a cleft extending from the capsular surface up to more than 50% depth (white arrow).
- (a and b) T1 fat-suppressed magnetic resonance arthrogram axial image in a 30-year-old female patient showing sub-labral sulcus at the posterior labrum as a smooth edged cleft (white arrow).
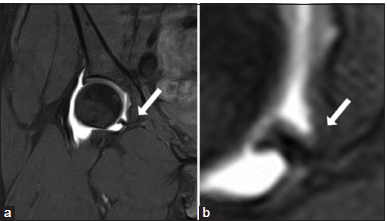
Labrocartilagenous cleft is seen at the junction of the acetabular labrum and the acetabular cartilage and can sometimes be confused with a labral tear. However, following the cartilage and its characteristic location helps in making the diagnosis [Figure 26].
- (a and b) T1 fat-suppressed magnetic resonance arthrogram axial image in a 30-year-old female patient showing labrocartilage cleft at the anterior labrum at the junction of the acetabular labrum and the articular cartilage (white arrow).
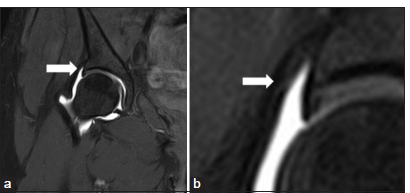
The acetabular labrum is deficient inferiorly and is bridged by the transverse acetabular ligament and forms a recess. It can be confused with an inferior labral tear[24] [Figure 27].
- (a and b) T1 fat-suppressed magnetic resonance arthrogram axial image in a 30-year-old female patient showing normal labroligamentum sulcus (white arrow) between the inferior transverse ligament and the acetabular labrum. A periligamentous recess is often seen with this sulcus.
The hip capsule inserts at the base of the labrum; however, it is attached medial to base of the labrum at the superior aspect, and a paralabral recess between the labrum and the joint capsule is seen better on a coronal scan [Figure 28].
- (a and b) T1 fat-suppressed magnetic resonance arthrogram axial image in a 30-year-old female patient showing normal perilabral sulcus between the acetabular labrum and the hip joint capsule (white arrow).
The iliopsoas tendon insertion can mimic a labral tear as the psoas tendon is flush against the joint capsule and labral surface. The distinction can be made by following the course of the tendon. Often the iliopsoas bursae can mimic paralabral cysts [Figure 29].

- (a and b) T1 fat-suppressed magnetic resonance arthrogram axial image in a 30-year-old female patient showing normal perilabral sulcus between the acetabular labrum and the hip joint capsule (white arrow).
ISCHIOFEMORAL IMPINGEMENT
Johnson reported ischiofemoral impingement in 1977 and described three cases presenting with post arthroplasty groin pain.[26] The symptoms are similar to FAI and include hip and groin pain which may be referred to the posterior thigh due to irritation of the sciatic nerve. There is a female preponderance and symptoms may be bilateral.
Characteristic imaging features are reduced space between the ischium and lesser trochanter which is occupied by the quadratus femoris muscle. The space is divided into the ischiofemoral and quadratus femoris space.
MRI is the preferred modality of imaging as it can allow measurement of the ischiofemoral space as well as evaluate the muscle edema of the quadratus femoris. The MRI should be performed in neutral position or internal rotation as external rotation of the hip will lead to overestimation of the narrowing.[27]
The ischiofemoral space is measured as the distance between the ischial tuberosity and the lesser trochanter. Singer et al. have described a cutoff value of <15 mm for diagnosis with a sensitivity of 77%, specificity of 81%, and accuracy of 74%.
The quadratus femoris space is measured as distance between the superolateral hamstring tendons and the posteromedial iliopsoas tendon or lesser trochanter and a cutoff of <10 mm with a sensitivity 79%, specificity 74%, and accuracy of 77%.[28]
The quadratus femoris edema and atrophy are commonly seen. Other imaging findings are sclerosis and cystic changes at opposing surfaces of the ischial tuberosity and the lesser trochanter, lesser trochanteric bursitis, edema at the hamstrings, and iliopsoas tendons [Figure 30].
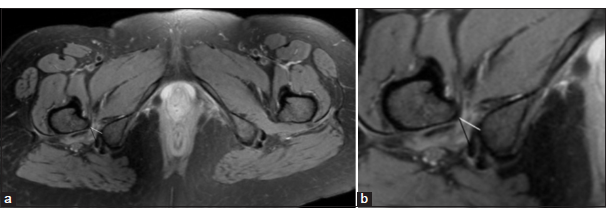
- (a and b) Magnetic resonance imaging axial PDFS images in a 34-year-old female patient with ischiofemoral impingement showing right-sided ischiofemoral impingement with reduced ischiofemoral (white line) and quadratus femoris space (black line) measuring <15 mm and 10 mm, respectively. There is quadratus femoris muscle edema and atrophy. The contralateral side shows normal ischiofemoral and quadratus femoris space.
In MRI, the axial plane is the most useful plane for obtaining measurements and STIR, PDFS, and T2-weighted images are used for assessing muscle edema and bursitis. Axial T1-weighted images are used for assessing muscle atrophy.[28,29]
CONCLUSION
The altered morphology of the hip joint could be due to acetabular (pincer) or femoral (CAM) origin. The significance of identifying these is paramount as it affects young adults and can progress to chondral loss fairly soon. The presence of pincer/CAM morphology does not equal FAI. FAI is the symptomatic presentation of abnormal abutment of the femur and acetabulum with soft-tissue injury, mainly the labrum. The article describes the morphological changes seen in FAI, labral tears, and their classifications, and a brief description of the ischiofemoral impingement.
Ethical approval
Institutional Review Board approval is not required.
Declaration of patient consent
The authors certify that they have obtained all appropriate patient consent.
Conflicts of interest
There are no conflicts of interest.
Use of artificial intelligence (AI)-assisted technology for manuscript preparation
The authors confirm that there was no use of artificial intelligence (AI)-assisted technology for assisting in the writing or editing of the manuscript and no images were manipulated using AI.
Financial support and sponsorship: Nil.
References
- Femoroacetabular impingement: A cause for osteoarthritis of the hip. Clin Orthop Relat Res. 2003;417:112-20.
- [CrossRef] [PubMed] [Google Scholar]
- Prevalence of femoroacetabular impingement imaging findings in asymptomatic volunteers: A systematic review. Arthroscopy. 2015;31:1199-204.
- [CrossRef] [PubMed] [Google Scholar]
- Femoroacetabular impingement: Defining the condition and its role in the pathophysiology of osteoarthritis. J Am Acad Orthop Surg. 2013;21:S7-15.
- [CrossRef] [Google Scholar]
- The Warwick Agreement on femoroacetabular impingement syndrome: An international consensus statement. Br J Sports Med. 2016;50:1169-76.
- [CrossRef] [PubMed] [Google Scholar]
- Femoroacetabular impingement: Radiographic diagnosis--what the radiologist should know. AJR Am J Roentgenol. 2007;188:1540-52.
- [CrossRef] [PubMed] [Google Scholar]
- Effect of pelvic inclination on determination of acetabular retroversion: A study on cadaver pelves. Clin Orthop Relat Res. 2003;407:241-8.
- [CrossRef] [PubMed] [Google Scholar]
- Inter-and intra-measurer error in the measurement of Reimers' hip migration percentage. J Bone Joint Surg Br. 2004;86(B):434-7.
- [CrossRef] [PubMed] [Google Scholar]
- Retroversion of the acetabulum: A cause of hip pain. J Bone Joint Surg Br. 1999;81:281-8.
- [CrossRef] [PubMed] [Google Scholar]
- The contour of the femoral head-neck junction as a predictor for the risk of anterior impingement. J Bone Joint Surg Br. 2002;84:556-60.
- [CrossRef] [PubMed] [Google Scholar]
- Crosstable lateral radiograph for screening of anterior femoral head-neck offset in patients with femoro-acetabular impingement. Hip Int. 2001;11:37-41.
- [CrossRef] [Google Scholar]
- Femoral antetorsion: Comparing asymptomatic volunteers and patients with femoroacetabular impingement. Radiology. 2012;263:475-83.
- [CrossRef] [PubMed] [Google Scholar]
- Fibrocystic changes at anterosuperior femoral neck: Prevalence in hips with femoroacetabular impingement. Radiology. 2005;236:237-46.
- [CrossRef] [PubMed] [Google Scholar]
- The diagnostic accuracy of acetabular labral tears using magnetic resonance imaging and magnetic resonance arthrography: A meta-analysis. Eur Radiol. 2011;21:863-74.
- [CrossRef] [PubMed] [Google Scholar]
- MR Arthrography versus conventional MRI in evaluation of labral and chondral lesions in different types of femoroacetabular impingement. Egypt J Radiol Nucl Med. 2017;48:169-78.
- [CrossRef] [Google Scholar]
- Magnetic resonance imaging of the hip for the evaluation of femoroacetabular impingement; past, present, and future. J Hip Preserv Surg. 2018;5:272-9.
- [Google Scholar]
- Protocol for the Femoroacetabular Impingement Trial (FAIT): A multi-centre randomised controlled trial comparing surgical and non-surgical management of femoroacetabular impingement. Bone Joint Res. 2014;3:321-7.
- [CrossRef] [PubMed] [Google Scholar]
- Regional articular cartilage abnormalities of the hip. AJR Am J Roentgenol. 2015;205:502-12.
- [CrossRef] [PubMed] [Google Scholar]
- The acetabular labral tear: An arthroscopic classification. Arthroscopy. 1996;12:269-72.
- [CrossRef] [PubMed] [Google Scholar]
- Hip morphology influences the pattern of damage to the acetabular cartilage: Femoroacetabular impingement as a cause of early osteoarthritis of the hip. J Bone Joint Surg Br. 2005;87(B):1012-8.
- [CrossRef] [PubMed] [Google Scholar]
- Lesions of the acetabular labrum: Accuracy of MR imaging and MR arthrography in detection and staging. Radiology. 1996;200:225-30.
- [CrossRef] [PubMed] [Google Scholar]
- Anatomy, histologic features, and vascularity of the adult acetabular labrum. Clin Orthop Relat Res. 2001;382:232-40.
- [CrossRef] [PubMed] [Google Scholar]
- The painful hip: New concepts. Skeletal Radiol. 2006;35:352-70.
- [CrossRef] [PubMed] [Google Scholar]
- A novel arthroscopic classification of labral tear in hip dysplasia. PLoS One. 2020;15:e0240993.
- [CrossRef] [PubMed] [Google Scholar]
- Can non-contrast 3T MRI scans predict the type of labral procedure in hip arthroscopy? Eur J Orthop Surg Traumatol. 2023;33:1291-7.
- [CrossRef] [PubMed] [Google Scholar]
- MR Arthrography of the hip: Differentiation between an anterior sub-labral recess as a normal variant and a labral tear. Radiology. 2008;249:947-54.
- [CrossRef] [PubMed] [Google Scholar]
- Impingement of the lesser trochanter on the ischial ramus after total hip arthroplasty. Report of three cases. J Bone Joint Surg Am. 1977;59:268-9.
- [CrossRef] [Google Scholar]
- Ischiofemoral impingement syndrome: An entity with hip pain and abnormalities of the quadratus femoris muscle. AJR. 2009;193:186-90.
- [CrossRef] [PubMed] [Google Scholar]
- Ischiofemoral impingement syndrome: A meta-analysis. Skeletal Radiol. 2015;44:831-7.
- [CrossRef] [PubMed] [Google Scholar]
- How to address ischiofemoral impingement? Treatment algorithm and review of the literature. J Hip Preserv Surg. 2017;4:289-98.
- [CrossRef] [PubMed] [Google Scholar]


