
Translate this page into:
Magnetic Resonance Imaging: Marrow Edema Patterns in Chronic Foot Pain

*Corresponding author: Dr. Hema Nalini Choudur, Musculoskeletal Division, Department of Radiology Imaging, Hamilton General Hospital, 237 Barton St. E, Hamilton, L9L2X2, Ontario, Canada. hnalinic@yahoo.com
-
Received: ,
Accepted: ,
How to cite this article: Hirji Z, Kaicker J, Ariyanayagam TA, Howey J, Choudur HN. Magnetic Resonance Imaging: Marrow Edema Patterns in Chronic Foot Pain. Indian J Musculoskelet Radiol 2020;2(1):26-31.
Abstract
Objectives:
The objective of the study was to determine whether there are specific magnetic resonance (MR) marrow edema patterns in patients with chronic foot pain and whether the individual small bones contribute significantly to pain.
Material and Methods:
A total of 153 symptomatic consecutive MR studies of patients with chronic foot pain and altered bone marrow signals of the foot and ankle were included in the study. Patients were placed into subgroups based on medial, central, or lateral marrow edema patterns. All cases with a clinical history or MR features of trauma, infection, inflammatory diseases, and tumors were excluded from the study. Statistical analysis was conducted to determine whether the marrow edema in each small bone of the subgroup was significant for the contribution of pain.
Results:
There were 84, 41, and 28 cases (153 patients) for the medial, central, and lateral marrow edema subgroups, respectively. The medial talus and medial and lateral sesamoid bones achieved statistical significance for an association between pain and marrow edema on MR images. Of the central group, sinus tarsi was statistically significant as a contributor of pain. None of the lateral bones were statistically significant as contributors of pain.
Conclusion:
Abnormal bone marrow edema patterns of the foot including the ankle on MRI fall into specific patterns of the medial, central, and lateral foot. This could be attributed to altered mechanical weight-bearing axis. The normal mechanical weight-bearing axis for the purpose of this study was along the long axis of the 2nd metatarsal, akin to the underlying seen in March fractures. The medial bone marrow edema was deemed to be a result of medial deviation of the normal mechanical weight-bearing axis, resulting in the marrow edema from the abnormal stress forces. The bone marrow edema pattern along the 2nd metatarsal was considered on the basis of excessive mechanical stress forces. The marrow edema pattern along the lateral foot, 4th and 5th metatarsals, and the lateral talus, calcaneus, and cuboid, was considered as a lateral deviation of the normal axis resulting in the abnormal stress and marrow edema pattern within these bones. By defining bone marrow edema patterns, we can assist orthopedic surgeons, physiatrists, and physiotherapists to provide appropriate corrective treatment including orthotics and physiotherapy. These MR features can also provide a baseline to monitor interval improvement after the application of the corrective measures.
Keywords
Bone marrow edema
Foot
Magnetic resonance imaging
Mechanical weight-bearing axis

INTRODUCTION
Determining an altered mechanical weight-bearing axis based on the magnetic resonance (MR) pattern of bone marrow edema in patients with non-traumatic, chronic foot pain could lead to more objective and effective treatment as well as providing a baseline to assess improvement with therapy. Studies that assessed changes in the foot and ankle after physical activity using MR images have investigated the link between marrow edema on MR images and altered biomechanics in healthy volunteers.[1,2] Elias et al. found that marrow edema was commonly seen within the talus in professional ballet dancers.[3] The previous research by Schweitzer et al. has attempted to determine if altered weight-bearing can cause the appearance of marrow edema by imaging healthy volunteers before and after a 2-week period of overpronation of their feet on weight- bearing.[4] Their results showed that this altered weight- bearing can cause increased marrow edema on MR images. However, this study had a small sample size of 12, which could limit the statistical interpretation of the results. Other works have also shown that different stress fracture patterns are seen in athletes, ballet dancers, and military recruits.[5] This suggests that differing foot positions cause alterations in the weight-bearing mechanism of the foot, resulting in abnormal stresses along differing axes.
Our study aims to expand on previous research and predict altered weight-bearing axis based on the MR bone marrow edema patterns. The previous research has not specifically looked at grouping specific edema patterns in the medial, central, and lateral bones of the foot including ankle utilizing MR images. Our investigation assesses whether these MR edema patterns can be attributed to specific altered mechanical axes causing the abnormal stresses on the foot.
The normal weight-bearing mechanism of the foot involves the central axis through the tibia, talus, calcaneus, and 2nd metatarsal (akin to the underlying mechanism seen in March fractures). There is an additional support from the three arches of the foot, namely, the medial and lateral longitudinal arches and the transverse arch [Figure 1].[6]

- Diagrammatic representation of the bones of the foot. The bones comprising the central axis of weight transmission are outlined in red. The bones of the medial arch are outlined in blue. The bones of the lateral arch are outlined in green.
For the purposes of this study, the central axis was deemed to be in alignment proximally with the Q (quadriceps) angle, which describes the pull of the quadriceps muscle on the patella and is used in the clinical evaluation of patellofemoral disorders such as maltracking and subluxation. The Q angle consists of two lines, the first drawn from the anterior superior iliac spine to the center of the patella and the second from the center of the patella to the tibial tubercle, and has been shown to be altered by foot position independent of hip and knee alignment.[7] On the basis of this previous literature as per this reference, we extended the second line inferiorly through the medial talus, lateral third of the navicular, middle cuneiform, and the 2nd metatarsal to provide a central line of axis of weight transmission through the ankle and foot [Figure 2]. This central axis is used only as a point of reference for marrow edema patterns. This study does not attempt to correlate Q angle with foot alignment or marrow edema.
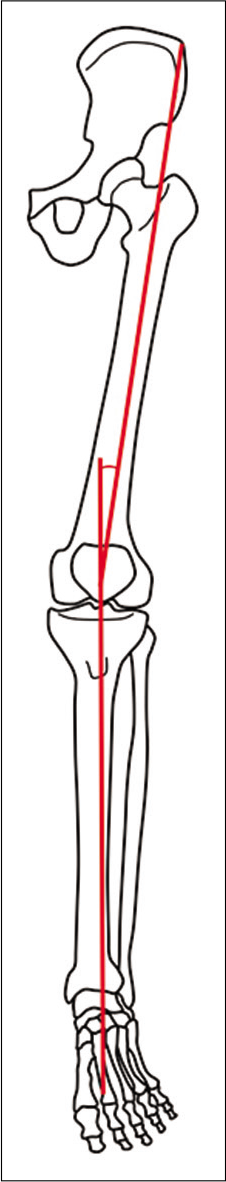
- Diagrammatic representation of the bones of the lower limb. The red lines indicate the vectors of the Q angle. The first line is drawn from the anterior superior iliac spine to the central patella. The second line is drawn from the central patella through the tibial tuberosity to the central tibial plafond. The angle formed by these two vectors constitutes the Q angle. When extended distally, the inferior vector continues through the talus, middle cuneiform and 2nd metatarsal, providing a central axis of weight transmission for the purpose of our study.
The lateral longitudinal arch [Figure 1] is formed by the lateral calcaneus, cuboid bone, lateral cuneiform, and the third, fourth, and fifth metatarsals, with stability provided by the short plantar ligaments, the peroneus longus, and brevis tendons, lateral tendons of flexor digitorum longus, abductor digiti minimi, lateral half of digitorum brevis, as well as the lateral bundle of the plantar fascia.[6]
The medial longitudinal arch [Figure 1] is comprised the medial talus, medial calcaneus, medial two-thirds of the navicular, medial cuneiform, and the first metatarsal as well as the sesamoid bones of the hallux. Stability is provided by the deltoid ligament complex and the spring ligament, the flexor hallucis longus tendon, medial tendons of flexor digitorum longus, abductor hallucis, and medial half of flexor digitorum brevis muscles, and the tibialis posterior tendon. Additional support is provided by the medial bundle of the plantar fascia.[6]
The transverse arch is located in the coronal plane in the forefoot and consists of the five metatarsal bases, cuboid bone, and three cuneiform bones. The ligamentous support of this arch comes primarily from the peroneus longus and tibialis posterior tendons, with additional contributions from the intercuneiform ligaments and the deep transverse metatarsal ligaments.[6]
There is a balance of weight transmission between the foot arches. In static weight-bearing, the lateral longitudinal arch aids with transmission of the weight-bearing load through the foot, as this is the predominant site of contact with the ground. The medial longitudinal arch and the transverse arch are responsible for shock absorption and propulsion during gait.[8]
The altered mechanical axes can affect the alignment of the hindfoot, with hindfoot varus or valgus deformity [Figure 3a-c]. Abnormalities of the longitudinal arches can also affect alignment, resulting in pes planus or pes cavus deformities [Figure 4a-c].
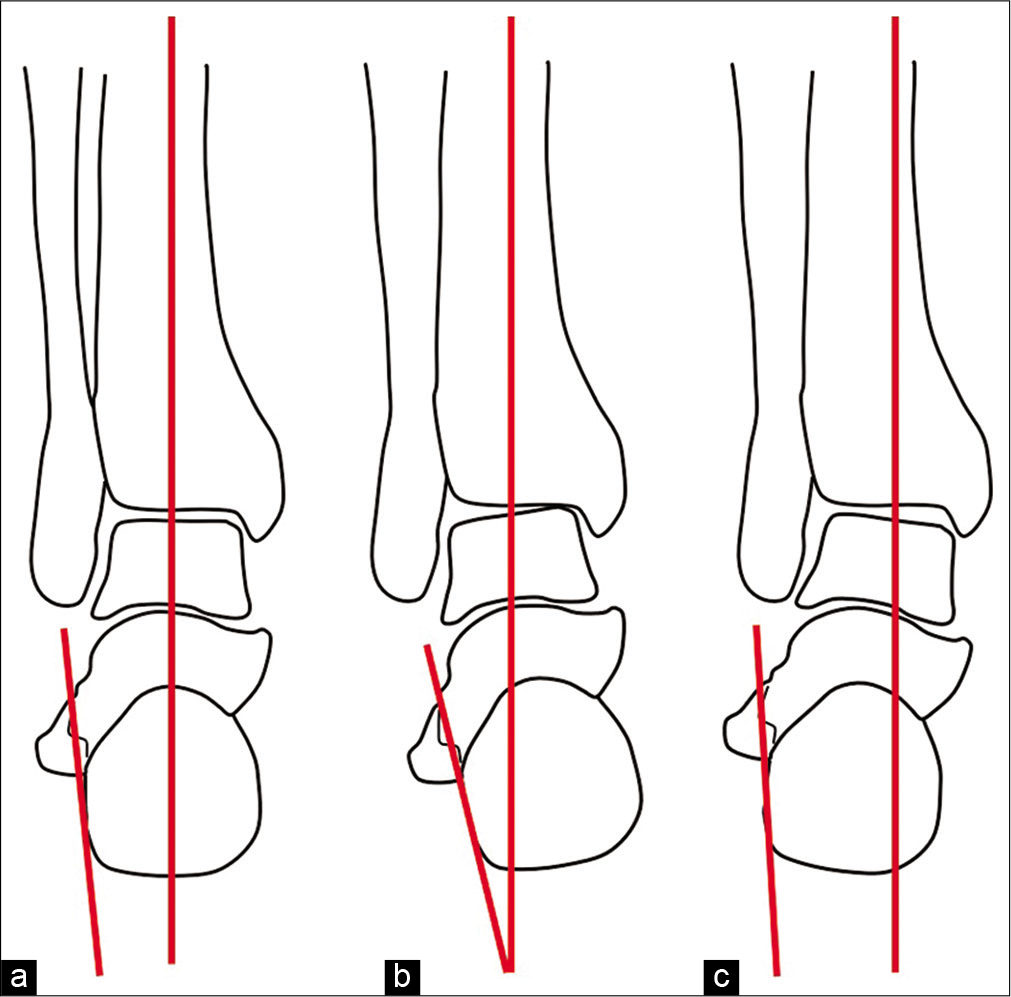
- Diagrammatic representation of the bones of the ankle and hindfoot in the coronal plane. The axis of the hindfoot is represented by red lines indicating the tibial axis and the lateral calcaneal border. (a) Normal hindfoot alignment. (b) Hindfoot varus with combined medial angulation of the talus, navicula and calcaneus relative to the tibial axis. (c) Hindfoot valgus with combined lateral angulation of the talus, navicula and calcaneus relative to the tibial axis.

- Diagrammatic representation of the bones of the foot and ankle in the sagittal plane showing the axis of the longitudinal arches. The axis of talus and 1st metatarsal are indicated by red lines. (a) Normal sagittal alignment, with a straight-line relationship between the talar and 1st metatarsal axis. (b) Pes planus deformity, with a plantar convexity to the relationship between the talar and 1st metatarsal axis. (c) Pes cavus deformity, with a dorsal convexity to the relationship between the talar and 1st metatarsal axis.
MATERIAL AND METHODS
The sample was generated from symptomatic MRI studies of the foot including ankle stored on picture archiving and communication system at Hamilton Health Sciences between the years 2005 and 2008. Appropriate institutional research ethics board approval was obtained. These patients were referred to MRI for medial, central, and lateral foot pain with no history of trauma, tumor, infection, or inflammatory disease. MRI studies with altered bone marrow signal in the foot were selected and reviewed for patterns of abnormal bone marrow edema and classified into medial, central, and lateral subgroups [Appendix 1, Table 1].
Inclusion and exclusion criteria
We selected adult patients between the age of 19 and 55 years. The total number of patients included in the sample was 153. There were 83 male and 70 female patients. Primarily, the short-tau inversion-recovery (STIR) or T2 fat sat sequences were assessed for high signal intensity in the bone marrow. The cases were subgrouped into abnormal bone marrow edema patterns based on the specific distribution (medial, central, and lateral) of the marrow edema in the small bones of the foot and ankle. Inclusion criteria included bone marrow edema of one or more bones of the foot. However, all cases with MR features of trauma, infection, inflammatory diseases, and tumors were excluded from the study.
Statistical analysis
Statistical analyses were conducted for patients with pain in the medial, central, and lateral bones in the foot. Cases were then subgrouped based on evolving patterns of bone marrow edema. Observations were made regarding consistency in evolving patterns. Any cause and effect relationship between altered weight-bearing axis and these bone marrow patterns were explored and individual bone contribution to pain was assessed.
RESULTS
From the medial marrow edema subgroup, three bones achieved statistical significance, the medial sesamoid bone, lateral sesamoid bone, and medial talus. Both sesamoids are significantly less responsible for pain than any of the other six medial bones while the medial talus was determined to be significantly significant for the association between pain and edema [Appendix 1, Table 2]. Figures [5–7] show examples of medial bone marrow edema. Only one central bone (marrow around the sinus tarsi) achieved statistical significance for chronic pain [Appendix 1, Table 3]. None of the lateral bones achieved statistical significance in terms of pain [Appendix 1, Table 4]. The difference in proportions between pain in a specific lateral bone and the other six lateral bones is most noticeable for the lateral calcaneus bone. Here, Chi- square is only large enough to yield a trend.

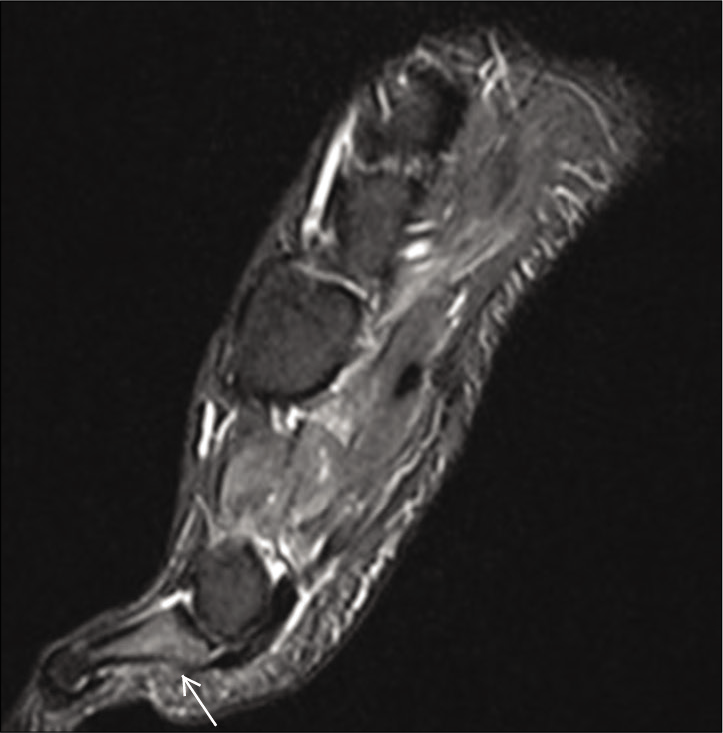
- MR marrow edema subgroups A- Coronal T2 fat sat sequence: Focal bone marrow edema in the 2nd metatarsal with reactive fluid in the 2nd MTP joint (white arrow). B- Sag T2 fat sat sequence: Focal bone marrow edema in the lateral portion of the distal calcaneus adjacent to the sinus tarsi and lateral cuboid (white arrows). C- Sagittal T2 fat sat sequence: Focal bone marrow edema of the 1st metatarsal (white arrow).
- Sagittal, coronal and axial T2 fat sat sequences. Medial distal foot pain: Focal bone marrow edema of the proximal phalanx (white arrow) and medial sesamoid of the first metatarsal (white arrowheads).

- Sagittal, coronal and axial T2 fat sat sequences. Medial distal foot pain: Focal bone marrow edema of the proximal phalanx (white arrow) and medial sesamoid of the first metatarsal (white arrowheads).
DISCUSSION
Excessive stress along either the central axis or along altered, abnormal axes medially and laterally, can lead to marrow edema in the involved small bones of the foot. This is seen in March fractures where there is excessive force along the central axis resulting in stress fractures of the 2nd metatarsal. Changes in the axis medially or laterally (varus or valgus tilt) as well as exaggeration or flattening of the longitudinal arches of the foot (pes cavus or planus) can result in abnormal stress in the medial or lateral group of bones. In our study, we hypothesized that this would result in specific bone marrow edema patterns. We also studied the statistical correlation between the marrow edema of each bone in the subgroup to pain. Bones with a higher Chi-square score and lower P value were significant as demonstrated in Appendix 1, Table 2.
The medial talus achieved statistical significance for an association between patients’ pain and marrow edema on MR while the medial sesamoid and lateral sesamoid bones were found to be significantly less responsible for pain as compared to the rest of the bones of the medial foot. One central bone (around the sinus tarsi) achieved statistical significance for being responsible for pain. None of the lateral bones were statistically significant as contributors of pain; however, the calcaneus and lateral malleolus yielded a “trend” toward being associated with pain.
The previous studies have demonstrated how both mechanical overload and alterations in biomechanics can cause changes in bone marrow edema in the foot.[9] One investigation demonstrated changes in bone marrow edema patterns within 2 weeks in patients who used foot pads that resulted in overpronation of the foot.[4] Another found such edema in joggers who ran more than 80 km in a week in comparison to non-runners, seen on STIR sequences.[2]
Other causes of bone marrow edema in the foot can be categorized as neoplastic, inflammatory, vascular, and degenerative,[10] which were not included in our study.
Strengths and limitations
This investigation delineated abnormal bone marrow edema patterns of the foot and ankle on MR imaging. The relationship of the bone marrow edema patterns and clinical pain was statistically investigated. In addition, statistical analysis was performed to compare each single bone against the others in the region for a relationship of bone marrow edema and pain. In the medial foot, the medial talus was most significantly correlated with pain. In the central foot, the sinus tarsi marrow edema correlated with clinical pain compared to other bones in the central foot and the lateral foot bones poorly correlated with clinical pain.
The above information regarding bone marrow edema patterns can now provide orthopedic surgeons, physiatrists, physiotherapists, and sport medicine specialists information regarding the bones affected by the mechanical alteration in weight-bearing, correlating the marrow edema pattern with pain. This can help direct appropriate management including orthotics and physiotherapy. The MRI can also serve as a baseline study for objective assessment of the response to such corrective methods.
The main limitation for this investigation was that it was conducted retrospectively. The hope is that this retrospective study can lead to prospective work including follow-up MR imaging after the use of corrective measures to assess the response/resolution of the marrow edema. The cause of the altered mechanical weight-bearing may be attributed to valgus/varus and pes cavus/planus deformities. However, this was not studied as a part of this investigation. Such a correlation will help to determine the exact cause and effect of the marrow edema patterns, which would be an extension of this study. Further studies to assess associated features, such as tendon and ligament injuries, will also be useful in establishing a pattern of disease.
CONCLUSION
The purpose of this investigation was to identify specific patterns of bone marrow edema of the foot in patients presenting with chronic foot pain and the specific contributions of each bone to foot pain. We concluded that there are abnormal MR bone marrow edema patterns of the foot that consistently fall into specific patterns of the medial, central, and lateral foot. The medial subgroup consisted of the first metatarsal, medial sesamoid, lateral sesamoid, medial cuneiform, navicular, medial talus, and medial calcaneus. The lateral subgroup consisted of the third to fifth metatarsals, lateral cuneiform, cuboid, lateral talus, and calcaneus. The central bone marrow edema subgroup lies between the medial and lateral subgroups.
The information of the MR bone marrow edema patterns will assist orthopedic surgeons and other physicians in obtaining appropriate corrective treatment including orthotics and physiotherapy. The findings can also be used in the assessment of the effects of corrective treatment with the resolution of marrow edema reflecting appropriate and adequate treatment.
Acknowledgment
The authors would like to thank Mary Lou Schmuch for her assistance with statistical analysis.
Declaration of patient consent
Patient’s consent not required as there are no patients in this study.
Financial support and sponsorship
Nil.
Conflicts of interest
There are no conflicts of interest.
References
- MRI abnormalities of foot and ankle in asymptomatic, physically active individuals. Skeletal Radiol. 2001;30:61-6.
- [CrossRef] [PubMed] [Google Scholar]
- Can running cause the appearance of marrow edema on MR images of the foot and ankle? Radiology. 1997;202:540-2.
- [CrossRef] [PubMed] [Google Scholar]
- Bone stress injury of the ankle in professional ballet dancers seen on MRI. BMC Musculoskelet Disord. 2008;9:39.
- [CrossRef] [PubMed] [Google Scholar]
- Does altered biomechanics cause marrow edema? Radiology. 1996;198:851-3.
- [CrossRef] [PubMed] [Google Scholar]
- MRI of sports-related injuries of the foot and ankle: Part 1. Curr Probl Diagn Radiol. 2003;32:139-55.
- [CrossRef] [Google Scholar]
- Evaluation of Q angle in differents static postures. Acta Ortop Bras. 2014;22:325-9.
- [CrossRef] [PubMed] [Google Scholar]
- Relationship between transverse arch height and foot muscles evaluated by ultrasound imaging device. J Phys Ther Sci. 2018;30:630-5.
- [CrossRef] [PubMed] [Google Scholar]
- Bone marrow edema syndrome of the foot: One year follow-up with MR imaging. Skeletal Radiol. 2003;32:273-8.
- [CrossRef] [PubMed] [Google Scholar]
- Bone marrow edema: An MRI diagnostic clue in patients with chronic foot and ankle pain. Alex J Med. 2010;46:327-33.
- [Google Scholar]
APPENDIX 1
| Medial | Central | Lateral |
|---|---|---|
| First metatarsal Medial sesamoid Lateral sesamoid Medial cuneiform Navicular Talus (medial) Calcaneous (medial) |
Second metatarsal Intermediate cuneiform Talus (mid) Calcaneous (mid) Sinus Tarsi Os trigonum Anterior subtalar joint Posterior subtalar joint |
ird metatarsal Fourth metatarsal Fifth metatarsal Lateral cuneiform Cuboid Talus (lateral) Calcaneous (lateral) |
| Bone | Chi square statistic DF = 1 | P value |
|---|---|---|
| First MT | 0.3193 | 0.85 |
| Medial sesamoid | 8.17 | 0.004 |
| lateral sesamoid | 10.35 Yates CCF applied | 0.001 |
| Medial cuneiform | 0.7983 | 0.37 |
| Navicular | 2.58 | 0.10 |
| Medial talus | 39.12 | 0.00001 |
| Calcaneous | 0.6227 | 0.43 |
| Tibia | 1.56 | 0.21 |
| Bone | Chi square statistic DF = 1 | P value |
|---|---|---|
| Second MT | 0.3755 | 0.95 |
| Intermediate Cunneform | 1.65 Yates CCF applied | 0.19 |
| Talus - mid | 0.6347 Yates CCF applied | 0.42 |
| Calcaneus/mid | 1.98 | 0.15 |
| Sinus tarsi syndrome (STS) * | 8.29 | 0.003 |
| O’s Trigonum Syndrome | 0.6347 Yates Chi square applied | 0.42 |
| Anterior subtalar joint | 0.0338 Yates Chi square applied | 0.85 |
| Post subtalar joint | 0.3042 Yates Chi square applied | 0.58 |
| Bone | Chi square statistic DF=1 | P value |
|---|---|---|
| ird MT | 0.9816 Yates CCF applied | 0.32 |
| Fourth MT | 0.9816 Yates CCF applied | 0.32 |
| Fifth MT | 0.5719 Yates CCF applied | 0.81 |
| Lateral cuneiform | 0.1412 Yates CCF applied | 0.70 |
| Cuboid | 0.5719 Yates CCF applied | 0.81 |
| Talus lateral | 0.7295 Yates Chi square applied | 0.39 |
| Calcaneous lateral | 3.15 | 0.07 |
| Lateral malleolus | 3.15 Yates CCF applied | 0.07 |


