
Translate this page into:
Comparison between dual-energy computed tomography and ultrasound in the diagnosis of gout

*Corresponding author: Tanya Bansal, Department of Radiodiagnosis, Era’s Lucknow Medical College, Lucknow, Uttar Pradesh, India. tanyadect@gmail.com
-
Received: ,
Accepted: ,
How to cite this article: Khanduri S, Singh V, Pathak V, Bansal T, Panwar M, Dhingra V, et al. Comparison between dual-energy computed tomography and ultrasound in the diagnosis of gout. Indian J Musculoskelet Radiol. 2024;6:10-7. doi: 10.25259/IJMSR_36_2023
Abstract
Objectives:
Gout is one of the most common inflammatory arthritic conditions that arise due to the super saturation of urate levels in body tissues, resulting in the formation of monosodium urate (MSU) crystals that get deposited in and around the joints. Clinical diagnosis of gout is generally made based on signs and symptoms. The biochemical diagnosis is based on the levels of serum uric acid. However, hyperuricemia is a weak marker for gout diagnosis. The gold standard for diagnosing gout is the identification of MSU crystals in the synovial fluid by Polaroid microscopy. However, it is an invasive procedure that could lead to complications such as joint effusion and intra-articular hemorrhage. Imaging offers a non-invasive method for the diagnosis of gout. Ultrasound (USG) has emerged as a useful measure for detecting joint effusion and synovitis, studying cartilage, describing early bone erosions, and evaluating tendons and crystal deposition. Dual-energy computed tomography (DECT) is a useful non-invasive technique that helps visualize MSU crystals, along with other soft tissue changes and erosive pathologies, at high resolution, much earlier than conventional radiography could do.
Material and Methods:
Clinically suspected or diagnosed gout patients in the age group of 20–75 years of both genders attending outpatient services were selected for the study. All the patients fulfilling the inclusion criteria of clinical suspicion of gout or already proven cases of gout were clinically examined, and body mass index, presenting complaints, symptomatic joints, past medical history, family history, and personal habits were noted. The diagnosis of gout was confirmed using the 2015 American college of rheumatology/European league against rheumatism (ACR/EULAR) classification criteria: A cut-off score >8 was considered diagnostic. Thereafter, all the patients underwent ultrasonographic and computed tomography evaluations. All the patient’s assessments were made at nine locations bilaterally – shoulder, neck, wrist, metacarpal, metatarsophalangeal, ankle, hip, knee, and elbow to check for multiple joint involvements. All the DECT images were post-processed, allowing analysis of images using the three material decomposition methods. On reconstructed DECT images, green color-coded MSU crystals were considered suggestive of gout.
Results:
The present study reported a higher detection of gout on DECT (97.1%) as compared to the USG (88.2%). Similarly, several studies reported a higher detection rate of MSU crystal deposition by DECT as compared to the detection of the double-contour sign by USG. This study reported sensitivity, specificity, positive predictive, and negative predictive value (PPV and NPV) of USG as 91%, 92%, 95%, and 85%, respectively. In contrast, DECT’s sensitivity, specificity, PPV, and NPVs were 96%, 100%, 100%, and 92%, respectively. DECT showed to have a high sensitivity as well as specificity.
Conclusion:
The study showed that DECT is more sensitive and had a better PPV and accuracy than USG in the diagnosis of gout. Keeping in view the high efficacy of DECT in diagnosing gouty joints, it is a strong candidate to emerge as a non-invasive imaging modality of choice for diagnosing gout.
Keywords
Gout
Monosodium urate crystals
Dual-energy computed tomography in gout
Ultrasound in gout
Double contour sign

INTRODUCTION
Gout is an inflammatory arthritic condition caused by high serum uric acid levels, causing monosodium urate (MSU) crystals to accumulate in joints.[1] In India, the prevalence is only 0.12%,[2] mainly affecting males over 45. Gout affects more urban areas and may be linked to lifestyle changes and metabolic syndrome prevalence in younger populations.[3]
The clinical presentation of gout is marked by acute attacks of severe pain and inflammation around peripheral joints, especially in the first metatarsophalangeal (MTP) joint.[4] Diagnosis is based on signs and symptoms, with serum uric acid levels being a weak marker. The gold standard is identifying MSU crystals in synovial fluid, but it is an invasive procedure, potentially leading to complications such as joint effusion.[5,6] Imaging provides a non-invasive diagnosis of gout, with a limited diagnostic role in the early stages compared to conventional radiology.[7] Imaging is helpful in differentiating gout from other clinically similar diseases, such as pigmented villonodular synovitis, psoriasis, and septic arthritis. Ultrasound (USG) has emerged as a useful measure for the detection of joint effusion and synovitis, differentiating between active and inactive synovitis, studying cartilage, describing bone contour for early erosions, and evaluating tendons and crystal deposition. Double-contour sign (DCS) is a highly specific USG feature that helps to diagnose gout.[8] Conventional computed tomography (CT), owing to its excellent resolution and high contrast, is considered to be the best technique for the assessment and characterization of crystal arthropathies.[9] However, it has limited use in the diagnosis of acute gout as it fails to detect inflammation, synovitis, tenosynovitis, and osteitis. Dual-energy CT (DECT) is a useful non-invasive technique that helps visualize MSU crystals, along with other soft tissue changes and erosive pathologies, at high resolution much earlier than conventional radiography could do.[10] However, despite its high accuracy in detecting MSU crystals in joints, tendons, ligaments, and soft tissues, it lags behind USG in detecting crystal deposition on the cartilage surface.[11]
Considering the usefulness of non-invasive measures for diagnosing gout, the present study was carried out to compare the usefulness of ultrasonography and DECT in the diagnosis and evaluation of clinically suspected gout patients.
MATERIAL AND METHODS
A cross-sectional study was carried out over 18 months in the Department of Radiodiagnosis with the collaboration of the Medicine and Rheumatology Department at a Tertiary Care Center. Clinically suspected/diagnosed gout patients in the age group of 20–75 years of both genders attending Outpatient services of Departments of Medicine and Rheumatology were selected for study. Pregnant women and patients with joint disorders other than gout were excluded from the study. Clearance for carrying out the study was obtained from the Institutional Ethical Committee vide approval letter numbered R cell EC/2021/132. The sample size was calculated by making projections based on the agreement of DECT with the US for detecting gout using the formula:
Where r = 0.698, the Kappa measure of agreement between DECT and US d = 1.5, the design effect for considering several parameters type I error α = 5%, corresponding to 95% confidence level type II error β = 10% for detecting results with 90% power of the study, data loss factor = 10%. Hence, the required sample size (n) was 34.
All the patients fulfilling the eligibility criteria were clinically examined, including demographics, medical history, family history, and habits. The diagnosis of gout was confirmed using the 2015 American college of rheumatology/European league against rheumatism (ACR/EULAR) classification criteria for gout[12] [Table 1]:
| Domain | Criteria | Categories | Score |
|---|---|---|---|
| Clinical | Pattern of joint/bursa involvement during symptomatic episode (s) ever | Ankle or mid-foot (as part of monoarticular or oligoarticular episode without involvement of first MTP joint) | 1 |
| Involvement of the first metatarsophalangeal joint (as part of monoarticular or oligoarticular episode) |
2 | ||
| Characteristics of symptomatic episode (s) ever: | One characteristic | 1 | |
| Two characteristics | 2 | ||
| (i)Great difficulty with walking or inability to use the affected joint (s) during a symptomatic episode ever (patient-reported) (ii)Can’t bear touch or pressure to the affected joint during a symptomatic episode ever (patient reported) (iii)Erythema overlying affected joint during a symptomatic episode ever (patient-reported or physician-observed) |
Three characteristics | 3 | |
| Time course of symptomatic episode (s) ever: Presence (ever) of ≥2, irrespective Of anti-inflammatory treatment: (i) Time to maximal pain<24 h (ii) Resolution of symptoms in≤14 days (iii)Complete resolution (to baseline level) between symptomatic episodes |
One typical episode | 1 | |
| Recurrent typical episodes | 2 | ||
| Clinical evidence of tophus: Draining or chalk-like subcutaneous nodule under transparent skin, often with overlying vascularity Location: Classic locations—joints, ears, olecranon bursae, finger pads, tendons (e.g., Achilles) |
Present | 4 | |
| Laboratory | Serum urate: Measured by uricase method. Ideally should be scored at a time when the patient was not receiving urate lowering treatment and it was>4 weeks from the start of an episode (i.e., during inter critical periods); if practicable, retest under those conditions. The highest value irrespective of timing should be scored | <4 mg/dL (0.24 mmol/L) | -4 |
| 6–8 mg/dL (0.36≤0.48 mmol/L) | 2 | ||
| 8≤10 mg/dL (0.48≤0.60 mmol/L) | 3 | ||
| >10 mg/dL (>0.60 mmol/L) | 4 | ||
| Synovial fluid analysis of a symptomatic (ever) joint or bursa: should be assessed by a trained observer | Not done | 0 | |
| MSU negative | -2 | ||
| Imaging | Imaging evidence of urate deposition in symptomatic (ever) joint or bursa: Ultrasound evidence of double contour sign OR dual energy-demonstrating urate deposition | Present (either modality) | 4 |
| Imaging evidence of gout-related joint damage: conventional radiography of the hands and/or feet demonstrate at least one erosion. | Present | 4 |
MTP: Metatarsophalangeal, MSU: Monosodium urate, ACR: American college of rheumatology, EULAR: European league against rheumatism
A cut-off score >8 was considered to be diagnostic confirmation of gout. Thereafter, all the patients underwent ultrasonographic and CT evaluations. All the patients’ assessments were made at 9 locations bilaterally: shoulder, neck, wrist, metacarpal, MTP, ankle, hip, knee, and elbow to check for multiple joint involvements. In total, 306 joint locations were evaluated. All the patient’s USGs were performed on GE, Logiq E9, and Milwaukee, USA, USG device. The double contour cartilage line is a specific ultrasound sign for gout, which is characterized by an echogenic line on the outer surface of the joint cartilage parallel to the subchondral bone as a result of deposition of monosodium urate crystals on the surface of hyaline articular cartilage.
All CT scans were performed on a 384-slice DECT scanner (Somatom Force, Siemens Healthcare, Erlangen, Germany), and all the images were post-processed on a workstation using Syngovia software that allows analysis of images using three material decompositions. Examinations were evaluated by an experienced radiologist working for 15 years. On reconstructed DECT images, green color-coded MSU crystals were considered suggestive of gout [Figures 1 and 2].
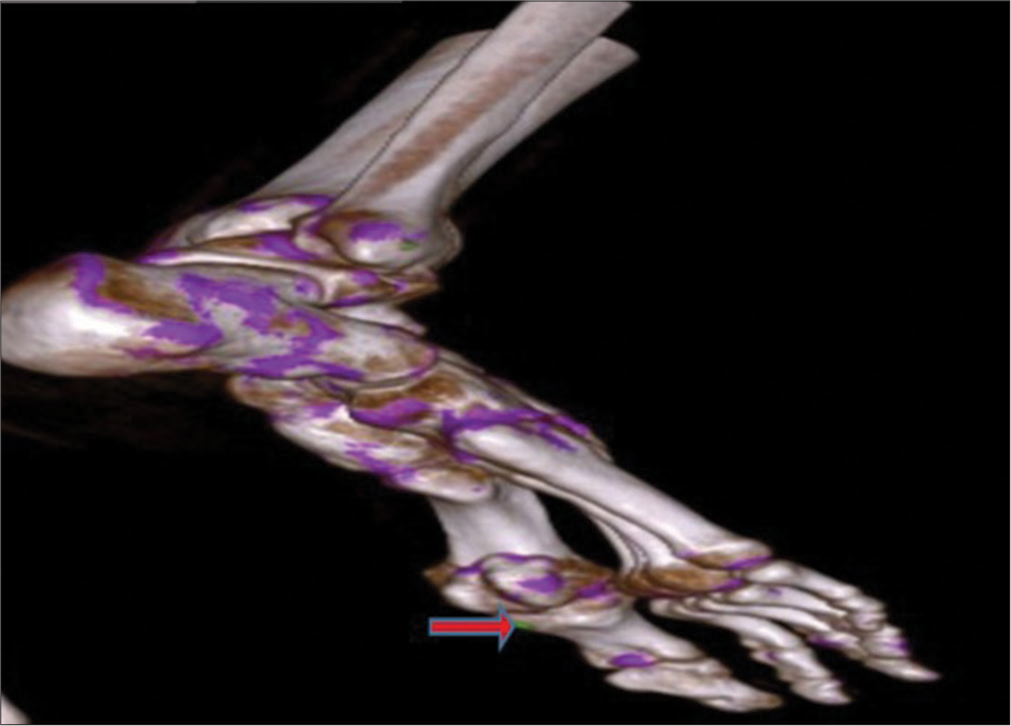
- Volume rendered dual-energy computed tomography image shows green color-coded monosodium urate crystal (shown by red arrow) along the inferior-lateral aspect of the 1st metatarsophalangeal joint.

- Volume rendered dual-energy computed tomography image shows green color-coded monosodium urate crystals (shown by red arrow) along the popliteus tendon, medial and lateral collateral ligament, patellar ligament of right knee joint and articular surfaces of both knee joints.
View
The data were entered into the computer in an MS Excel sheet and used for statistical analysis. The statistical analysis was done using Statistical Package for Social Sciences version 15.0 Software. The values were represented in Number (%) and Mean ± Standard Deviation. The chi-square test, sensitivity, specificity, positive predictive value (PPV), negative predictive value (NPV), and level of significance “P < 0.05” was considered statistically significant. For the comparison of categorical data, the Chi-square test was used, while quantitative data were compared using Student’s “t”-test.
RESULTS
This study compared DECT with USG for gout diagnosis. 34 patients who met the trial criteria were enrolled.
The mean age of patients was 54.59 ± 9.2 years. Most patients (38.1%) were 51–60 years of age. The majority of patients were male (73.5%). Most of the patients had occupations suggestive of a sedentary lifestyle, as 12 (35.3%) patients were in service or as assistants, and (20%) of them were housewives. Half the patients had diabetes, and 94.1% had hypertension. Obesity was common (61.8%). 14.7% of patients had a family history of rheumatological diseases. Clinical presentation included swelling, erythema, discomfort, warmth, and tenderness. 25 patients (73.5%) presented with difficulty in walking.
No patient had symptomatic shoulder, metacarpals, hip, or neck joints. Symptomatic involvement of elbow, wrist, knee, ankle, and MTP was seen in 11.8%, 8.8%, 26.5%, 2.9%, and 50.0 % of patients. Bilateral involvements were the most common for knees (66.7%) [Table 2]. Sonography showed the involvement of 42 joints [Table 3], while DECT indicated 45 joints involvement [Table 4].
| S. No. | Site | Not involved | Left | Right | Bilateral |
|---|---|---|---|---|---|
| Total number of symptomatic joints involved=46 | |||||
| 1. | Shoulder | 34 (100.0) | 0 (0.0) | 0 (0.0) | 0 (0.0) |
| 2. | Elbow | 30 (88.2) | 1 (2.8) | 2 (5.9) | 1 (2.9) |
| 3. | Wrist | 31 (91.2) | 2 (5.9) | 1 (2.9) | 0 (0.0) |
| 4. | Metacarpals | 34 (100.0) | 0 (0.0) | 0 (0.0) | 0 (0.0) |
| 5. | Hip | 34 (100.0) | 0 (0.0) | 0 (0.0) | 0 (0.0) |
| 6. | Knee | 25 (73.5) | 0 (0.0) | 3 (8.8) | 6 (17.6) |
| 7. | Ankle | 33 (97.1) | 0 (0.0) | 1 (2.9) | 0 (0.0) |
| 8. | Metatarsophalangeal | 17 (50.0) | 7 (20.6) | 5 (14.7) | 55 (14.7) |
| 9. | Neck | 34 (100.0) | 0 (0.0) | 0 (0.0) | 0 (0.0) |
ACR: American college of rheumatology, EULAR: European league against rheumatism
| S. No. | Site | Not involved | Left | Right | Bilateral |
|---|---|---|---|---|---|
| Total number of symptomatic joints involved=42 | |||||
| 1. | Shoulder | 34 (100.0) | 0 (0.0) | 0 (0.0) | 0 (0.0) |
| 2. | Elbow | 30 (88.2) | 1 (2.9) | 2 (5.9) | 1 (2.9) |
| 3. | Wrist | 34 (100.0) | 0 (0.0) | 0 (0.0) | 0 (0.0) |
| 4. | Metacarpals | 34 (100.0) | 0 (0.0) | 0 (0.0) | 0 (0.0) |
| 5. | Hip | 34 (100.0) | 0 (0.0) | 0 (0.0) | 0 (0.0) |
| 6. | Knee | 25 (73.5) | 0 (0.0) | 3 (8.8) | 6 (17.6) |
| 7. | Ankle | 33 (97.1) | 0 (0.0) | 1 (2.9) | 0 (0.0) |
| 8. | Metatarsophalangeal | 18 (52.9) | 7 (20.6) | 4 (11.8) | 5 (14.7) |
| 9. | Neck | 34 (100.0) | 0 (0.0) | 0 (0.0) | 0 (0.0) |
| S. No. | Site | Not involved | Left | Right | Bilateral |
|---|---|---|---|---|---|
| Total number of symptomatic joints involved=45 | |||||
| 1. | Shoulder | 34 (100.0) | 0 (0.0) | 0 (0.0) | 0 (0.0) |
| 2. | Elbow | 30 (88.2) | 1 (2.9) | 2 (5.9) | 1 (2.9) |
| 3. | Wrist | 31 (91.2) | 2 (5.9) | 1 (2.9) | 0 (0.0) |
| 4. | Metacarpals | 34 (100.0) | 0 (0.0) | 0 (0.0) | 0 (0.0) |
| 5. | Hip | 34 (100.0) | 0 (0.0) | 0 (0.0) | 0 (0.0) |
| 6. | Knee | 25 (73.5) | 0 (0.0) | 3 (8.8) | 6 (17.6) |
| 7. | Ankle | 33 (97.1) | 0 (0.0) | 1 (2.9) | 0 (0.0) |
| 8. | Metatarsophalangeal | 18 (52.9) | 7 (20.6) | 4 (11.8) | 5 (14.7) |
| 9. | Neck | 34 (100.0) | 0 (0.0) | 0 (0.0) | 0 (0.0) |
DECT: Dual-energy computed tomography. n (percentage)
USG showed 93.3% cartilage involvement in knee joints. Bone involvement was maximum for elbow joint (40%) and knee joint (40%). On DECT, maximum cartilage involvement was seen in knee joints (86.7%). DECT showed maximum bone involvement for the knee joint (53.3%). DECT had higher sensitivity as well as NPV as compared to USG. The accuracy of USG was 91.2% compared to 97.1% for DECT [Table 5].
| Modality | ACR/EULAR Diagnosis | Statistics | ||
|---|---|---|---|---|
| Unilateral | Bilateral | Not involved | ||
| USG | ||||
| Unilateral | 20 | 1 | 0 | Sensitivity 91% |
| Bilateral | 0 | 11 | 0 | Specificity 92% |
| Not involved | 2 | 0 | 0 | PPV 95% |
| NPV 85% | ||||
| Agreement 78% | ||||
| P<0.001 | ||||
| DECT | ||||
| Unilateral | 21 | 0 | 0 | Sensitivity 96% |
| Bilateral | 0 | 12 | 0 | Specificity 100% |
| Not involved | 1 | 0 | 0 | PPV 100% |
| NPV 92% | ||||
| Agreement 94% | ||||
| P<0.001 | ||||
USG: Ultrasound, DECT: Dual-energy computed tomography, PPV: Positive predictive value, NPV: Negative predictive value, ACR: American college of rheumatology, EULAR: European league against rheumatism
Statistically, there was no significant difference between the two groups for the proportion of different structural abnormalities in the detected joints by each technique.
DISCUSSION
Gout diagnosis is challenging, and DECT is a promising noninvasive imaging modality. However, being a new imaging modality, its efficacy against USG remains controversial.[13] Hence, the present study was undertaken to assess the diagnostic accuracy of DECT in gout and compare it with USG.
USG is helpful in identifying synovitis and erosions effectively. Erosions are seen as cortical breaks.[14] The presence of generic features like DCS and tophi on USG is highly sensitive and specific for the detection of gout even at the subclinical level.[15] DCS appears as a hyper-echoic irregular band over the articular cartilage, representing the deposition of MSU crystals, and is almost a confirmatory sign of gout [Figure 3].[16] On USG, Tophi appears as “hyperechoic heterogeneous soft tissue deposits with or without post echoic shadowing, iso-echoic/hyper-echoic nodular deposits, bright spots, and hyper-echoic areas” within the joint, burse, in relation to the tendons, ligaments, and soft tissue.[17] The limitations of USG for diagnosis of hand and wrist gout, especially in case of extra-articular urate deposition.[18]
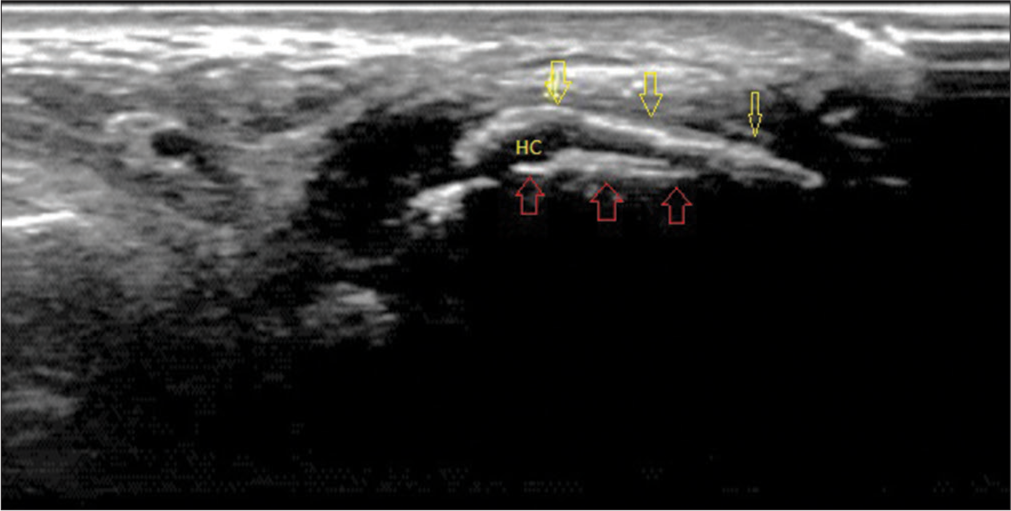
- Ultrasound image of the first metatarsophalangeal joint in longitudinal plantar view showing double contour sign in which monosodium urate crystals (yellow arrows) characterized by an echogenic line on the hypoechoic hyaline articular cartilage parallel to the bony contour of the joint (red arrows). (HC: Hyaline cartilage).
DECT offers the advantage of its ability to differentiate the target with two different photon energy levels. It uses independent tube current modulation, iterative reconstruction, and integrated circuits within the detector module to produce high-resolution images with excellent material separation without increasing radiation dose compared to conventional single-energy scans.[19] This differentiating ability of DECT has also been utilized for the diagnosis and description of gout, with the premise that visualization at two different energy levels and an algorithm-based reconstruction. In context with gout, the algorithm is targeted to separate MSU crystals from calcium by taking soft tissue as the reference point. The reconstruction is built on the characteristic that materials with a high atomic number, such as calcium, exhibit higher attenuation at higher photon energies, independent of material density or concentration, than does a material composed of low atomic number materials, such as MSU.[20]
In the present study, we included 34 patients with clinical suspicion/confirmed diagnosis of gout. Incidentally, all the patients were confirmed as having gout. In the present study, the mean age of patients was 54.59 ± 9.20 years, and the majority of patients were male (73.5%). Similar to the present study, the higher mean age of the patients and a higher proportion of the male population were reported by Klauser et al.,[18] Pascart et al.[21] and Zhu et al.[13] Like the present study, all these studies endorse the epidemiological reports indicating the association of gout with older age and the male sex.[3]
In the present study, there was a dominance of those with occupations suggestive of sedentary lifestyles (housewives, service/assistants, officers, and retired persons) (70.6%) and obesity (61.8%). Similar to the present study, a dominance of those with high body mass index (BMI) has also been reported in previous studies. Pascart et al.[21] and Wang et al.[22] reported the mean BMI of patients as 28.5 kg/m2 and 27.7 kg/m2, respectively.
In the present study, the current history of diabetes or hypertension was positive in 50% or 94.1% of patients, respectively. A previous history of diabetes and hypertension was also reported by 47.1% and 41.2% of patients, respectively. Alcohol consumption was reported in 23.5% of patients. Medical illnesses such as diabetes and hypertension, habits such as alcohol consumption, and genetic factors are recognized risk factors for gout, as reported in different epidemiological studies.[3] In different comparative studies, a high prevalence of these risk factors has been documented. Pascart et al.[21] in their study, 26.6% of cases have a history of diabetes, and 53.1% have a history of hypertension.
In the present study, the MTP joint was the most commonly involved site [Figure 4], followed by the knee joint [Figure 5]. None of the patients had involvement in the shoulder, hip, neck, and metacarpals. Similar to the present study, Pascart et al.[21] and Wang et al.[22] showed the MTP joint as the most commonly involved site in their study.
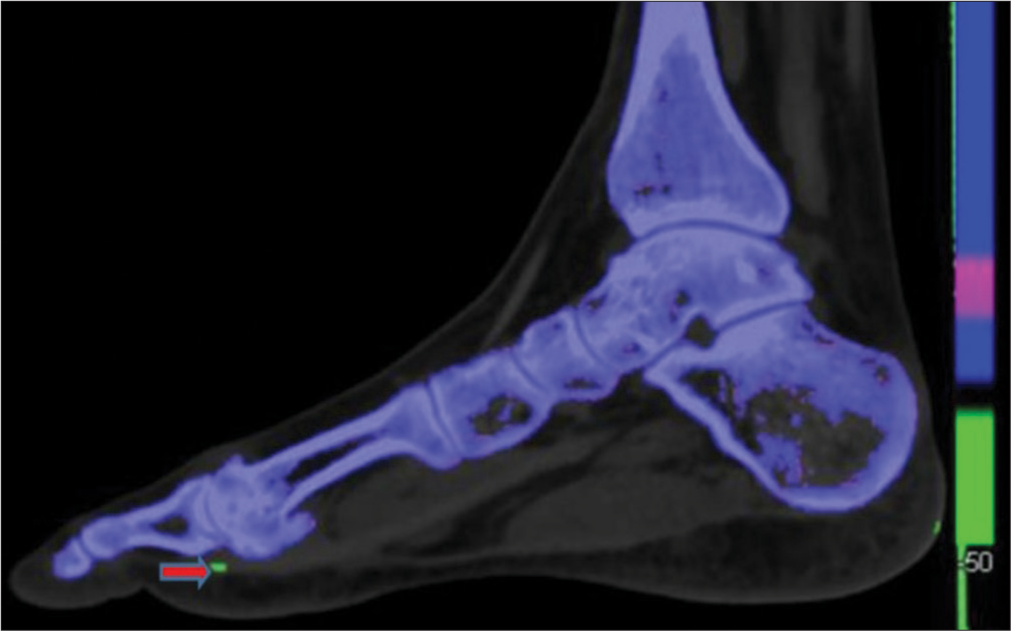
- Dual energy computed tomography image of foot in the sagittal plane shows green color coded monosodium urate crystal (shown by red arrow) along the inferior-lateral aspect of the1st metatarsophalangeal joint.
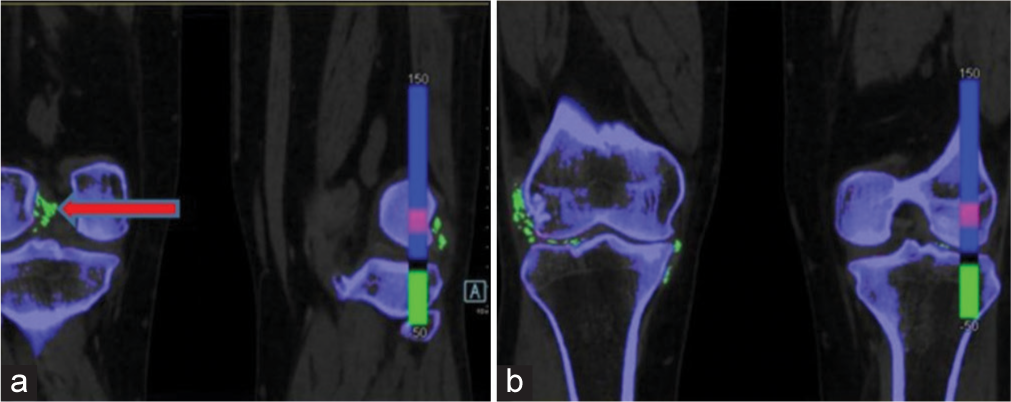
- Dual-energy computed tomography image in the coronal section shows green colour-coded monosodium urate (MSU) deposits (shown by red arrow), (a) along the cruciate ligaments of right knee joint, (b) MSU deposits along the popliteus tendon, medial and lateral collateral ligament of right knee joint and articular surfaces of both knee joints.
In the present study on USG, 88.2% of patients were found to have gout, compared to 97.1% by DECT. Several studies also report a higher detection rate of MSU crystal deposition by DECT as compared to the detection of DCS by USG. In their study, Strobl et al.,[23] reported positive diagnosis in 80% of cases by DECT compared to 50.8% of cases by USG. In a study by Zhu et al.,[13] DECT detected positive findings in 50% of cases, whereas for USG, they were seen in 39.1% of cases only. Both of these studies indicate higher sensitivity of DECT compared to USG. However, Wang et al.,[22] in their study documented a higher detection rate for USG (11.1%) compared to DECT (8.9%). Considering the fact that unlike DCS, which is a specific sign of MSU crystal deposition for USG but at the same time less sensitive too, DECT, through reconstructive images, provides green-color coded identification of MSU deposition in a more sensitive manner.[9]
In the present study, we found the sensitivity, specificity, PPV, and NPV of USG to be 91%, 92%, 95%, and 85%, respectively. In contrast, DECT’s sensitivity, specificity, and PPV and NPVs were 96%, 100%, 100%, and 92%, respectively. DECT generally has a high sensitivity as well as specificity. The false-negative patients were observed among patients with acute, recent-onset gout. The false-positive patients had advanced knee osteoarthritis.
The lower sensitivity of USG for detecting gout has also been documented by Klauser et al.,[18] who found the sensitivity of USG against DECT to be 70.1% only. This study also concluded that the sensitivity of USG was higher for intraarticular diagnosis (80.3%) as compared to extra-articular diagnosis (42.5%). The authors highlighted the limitations of USG for the diagnosis of hand and wrist gout, especially in the case of extra-articular urate deposition.
The present study’s findings agree with Singh et al.[24] who documented the sensitivity of DECT at 91% and specificity at 100% by DECT compared to 84% (sensitivity) and 80% (specificity) for USG. This could probably be due to a study population with a positive final diagnosis, affecting the sensitivity positively.
In the present study, the agreement between the final diagnosis and USG findings was 78%, and the agreement between the final diagnosis and DECT was 98%. Contrary to the present study, Gruber et al.[25] in their study, found USG to have an absolute agreement with the final diagnosis, whereas the same could be established in only 86.5% for DECT.
The study has limitations due to an all-positive population and potential error in asymptomatic joints, though, by the inclusion of 9 different locations, we tried to substantiate this possible error. Another limitation is due to the small study sample. Because of these limitations, the present study’s findings must be viewed with caution and should not be generalized.
CONCLUSION
Out of 34 patients enrolled in the study, 46 joints were confirmed with a diagnosis of gout using the ACR/EULAR, 2015 criteria. The MTP joint was the most commonly involved site, followed by the knee joint. On USG, a total of 88.2% were found to have a diagnosis of gout, compared to 97.1% on DECT. Compared to ACR/EULAR, 2015, DECT outperforms USG in diagnosing gout, with higher sensitivity, specificity, and PPVs. It is a strong candidate for the noninvasive gold standard, with high efficacy in diagnosing gouty joints. Further studies to substantiate the findings of the present study are recommended.
Ethical approval
The author(s) declare that they have taken the ethical approval from the Institutional ethics committee and the approval number is (R cell EC/2021/132).
Declaration of patient consent
The authors certify that they have obtained all appropriate patient consent.
Conflicts of interest
There are no conflicts of interest.
Use of artificial intelligence (AI)-assisted technology for manuscript preparation
The author confirms that there was no use of artificial intelligence (AI)-assisted technology for assisting in the writing or editing of the manuscript and no images were manipulated using AI.
Financial support and sponsorship
Nil.
References
- Global epidemiology of gout: Prevalence, incidence and risk factors. Nat Rev Rheumatol. 2015;11:649-62.
- [CrossRef] [PubMed] [Google Scholar]
- Prevalence of rheumatic diseases in a rural population in Western India: A WHO-ILAR COPCORD study. J Assoc Physicians India. 2001;49:240-6.
- [Google Scholar]
- New insights into the epidemiology of gout. Rheumatology (Oxford). 2009;48(Suppl 2):ii2-8.
- [CrossRef] [PubMed] [Google Scholar]
- Gout in Indian scenario In: Medicine update 2013. Mumbai: Association of Physicians of India; 2013. p. :444-8.
- [Google Scholar]
- Acute gout attack with normal serum uric acid levels. Rev Med Chir Soc Med Nat Iasi. 2014;118:942-5.
- [Google Scholar]
- Relevant aspects of imaging in the diagnosis and management of gout. Rev Bras Reumatol Engl Ed. 2017;57:64-72.
- [CrossRef] [PubMed] [Google Scholar]
- The diagnostic performance of musculoskeletal ultrasound in gout: A systematic review and meta-analysis. PLoS One. 2018;13:e0199672.
- [CrossRef] [PubMed] [Google Scholar]
- Imaging in gout and other crystal-related arthropathies. Rheum Dis Clin North Am. 2016;42:621-44.
- [CrossRef] [PubMed] [Google Scholar]
- Dual-energy CT as a potential new diagnostic tool in the management of gout in the acute setting. Am J Roentgenol. 2010;194:1072.
- [CrossRef] [PubMed] [Google Scholar]
- Systemic staging for urate crystal deposits with dual-energy CT and ultrasound in patients with suspected gout. Rheumatol Int. 2014;34:763-71.
- [CrossRef] [PubMed] [Google Scholar]
- 2015 Gout classification criteria: An American college of rheumatology/European league against rheumatism collaborative initiative. Arthritis Rheumatol. 2015;67:2557-68.
- [CrossRef] [PubMed] [Google Scholar]
- Comparison between dual-energy computed tomography and ultrasound in the diagnosis of gout of various joints. Acad Radiol. 2015;22:1497-502.
- [CrossRef] [PubMed] [Google Scholar]
- Musculoskeletal ultrasound including definitions for ultrasonographic pathology. J Rheumatol. 2005;32:2485-7.
- [Google Scholar]
- Ultrasound joint inflammation in rheumatoid arthritis in clinical remission: How many and which joints should be assessed? Arthritis Care Res (Hoboken). 2013;65:512-7.
- [CrossRef] [PubMed] [Google Scholar]
- Ultrasound imaging for the rheumatologist XXXVI, Sonographic assessment of the foot in gout patients. Clin Exp Rheumatol. 2011;29:901-5.
- [Google Scholar]
- A systematic review of ultrasonography in gout and asymptomatic hyperuricaemia. Ann Rheum Dis. 2013;72:638-45.
- [CrossRef] [PubMed] [Google Scholar]
- Gout of hand and wrist: The value of US as compared with DECT. Eur Radiol. 2018;28:4174-81.
- [CrossRef] [PubMed] [Google Scholar]
- Dual-energy CT: Radiation dose aspects. AJR Am J Roentgenol. 2012;199:S16-25.
- [CrossRef] [PubMed] [Google Scholar]
- Dual-energy CT in gout-a review of current concepts and applications. J Med Radiat Sci. 2017;64:41-51.
- [CrossRef] [PubMed] [Google Scholar]
- Ultrasonography and dual-energy computed tomography provide different quantification of urate burden in gout: Results from a cross-sectional study. Arthritis Res Ther. 2017;19:171.
- [CrossRef] [PubMed] [Google Scholar]
- Detection of uric acid crystal deposition by ultrasonography and dual-energy computed tomography: A cross-sectional study in patients with clinically diagnosed gout. Medicine (Baltimore). 2018;97:e12834.
- [CrossRef] [PubMed] [Google Scholar]
- Acute gouty knee arthritis: Ultrasound findings compared with dual-energy CT findings. AJR Am J Roentgenol. 2018;210:1323-9.
- [CrossRef] [PubMed] [Google Scholar]
- Gout and hyperuricaemia in the USA: Prevalence and trends. Rheumatology (Oxford). 2019;58:2177-80.
- [CrossRef] [PubMed] [Google Scholar]
- Dual-energy computed tomography compared with ultrasound in the diagnosis of gout. Rheumatology (Oxford). 2014;53:173-9.
- [CrossRef] [PubMed] [Google Scholar]


