
Translate this page into:
MRI ankle in juvenile idiopathic arthritis and its comparison with clinical disease activity scores

*Corresponding author: Parikha Rampal, Department of Radiodiagnosis, ABVIMS and Dr Ram Manohar Lohia Hospital, New Delhi, India. parikha2993@gmail.com
-
Received: ,
Accepted: ,
How to cite this article: Rampal P, Sachdev N, Khurana R, Taneja A. MRI ankle in juvenile idiopathic arthritis and its comparison with clinical disease activity scores. Indian J Musculoskelet Radiol. 2023;5:122-7. doi: 10.25259/IJMSR_29_2023
Abstract
Objectives:
Juvenile idiopathic arthritis (JIA) is a common cause of morbidity and consequent disability among youth up to 16 years of age. Our study aims to image the ankle joints of JIA patients and correlate the findings with the clinical disease activity scores. Juvenile Arthritis Disease Activity Score (JADAS-27) is used by pediatricians to assess disease activity in JIA patients. There are four factors that determine this score – Global assessment of disease activity by the physician as well as patient/parent, joint count with active disease, and erythrocyte sedimentation rate (ESR). However, these clinical scores are dependent on the clinician’s experience and observation and, therefore, subjective.
Material and Methods:
Thirty patients of either sex with a clinical diagnosis of JIA as per the International League of Association for Rheumatology definition with clinically involved ankle joints were included in the study. Chronic arthritis due to other causes, such as infection, trauma, and so on, was excluded. All clinically diagnosed cases of JIA were subjected to magnetic resonance imaging (MRI) evaluation on Siemens Skyra 3 Tesla High-Resolution MR system using a dedicated coil for the ankle joint. Six sub-joints for each patient are evaluated, namely - The tibiotalar joint, subtalar joint, calcaneocuboid joint, calcaneonavicular joint, naviculocuneiform joint, and tarsometatarsal joint. Image analysis and scoring shall be done for each patient at each joint as per the Juvenile Arthritis MRI SCORE, consisting of the following parameters-synovial hypertrophy score, cartilage lesion score, bone erosion score, and bone marrow change score. Each of these scores is calculated individually based on the percentage of involved bone volume. All individual scores were summed to get the total MRI Score. The data collected were then statistically analyzed.
Results:
A positive correlation was sought between the JADAS-27 score and the total MRI score with the P-value being 0.03. A positive correlation was also found between the total MRI score and the ESR value of the patient (P - 0.02).
Conclusion:
MRI findings can be a potential marker of disease activity in JIA patients and these findings could also predict the prognosis accurately in these patients. The findings are objective and comparable to the aforementioned clinical scores.
Keywords
Juvenile idiopathic arthritis
Magnetic resonance imaging ankle
Juvenile arthritis disease activity score

INTRODUCTION
Juvenile idiopathic arthritis (JIA) is the most common chronic rheumatic disease of children and one of the leading causes of morbidity and disability, characterized by sustained synovial inflammation and risk of joint destruction.[1]
The International League of Association for Rheumatology defines JIA as “any arthritis of unknown etiology that manifests before the age of 16 years and persists for at least six weeks while excluding other known conditions.”[2] It is classified into the following types, namely systemic onset JIA, polyarticular JIA rheumatoid factor positive, polyarticular JIA rheumatoid factor negative, oligoarticular JIA, juvenile psoriatic arthritis, enthesitis-related arthritis, and undifferentiated arthritis.[2]
The disease usually involves the larger joints, most commonly involved being the knee (74%), then the ankle (58%), hip, wrist, and elbow. The small joints of the hand are involved in the polyarticular subtype, most commonly involving the metacarpophalangeal joint.[3]
Some patients show signs of permanent joint damage resulting in deformities. About 31–55% of JIA patients show signs of active disease in adulthood.[4]
Pediatricians have developed certain scoring systems to evaluate disease activity in the patient, such as the Juvenile Arthritis Disease Activity Score (JADAS) or the juvenile arthritis damage index, which are frequently used in clinical practice for the disease evaluation of these patients.[5] JADAS-27 is a composite clinical score comprising four components-physician’s global assessment of disease activity score, parent/patient assessment of general well-being, number of active joints involved, and erythrocyte sedimentation rate (ESR).[6]
Imaging plays an important role in JIA as it helps confirm the inflammatory nature of the disease and can help rule out other causes of chronic arthritis in childhood, the most common being infection. Radiographs have been traditionally used to examine the affected joints in JIA. The main limitation of conventional radiography is that it does not allow direct examination of the articular cartilage, synovium, and other important non-calcified structures in a joint.
Musculoskeletal ultrasound (USG) is increasingly becoming popular for its ability to dynamically visualize the synovium and the articular cartilage. USG-guided corticosteroid injection administration in the targeted joints makes USG indispensable in musculoskeletal diseases. However, USG is an operator-dependent modality and has a steep learning curve.[5]
Contrast-enhanced MRI is the modality of choice in JIA for detecting changes in the affected joints. T1-weighted MR images are used to assess the bone marrow and erosions. Short tau inversion recovery MR sequence is used to evaluate the joint and tenosynovial fluid, cartilage, marrow edema, and tendons. Intravenous contrast administration is essential for distinguishing active synovial inflammation from joint effusions or fibrotic pannus. The morphologic changes in the articular cartilage are easily detectable on MR.[7]
The objective of this study is to evaluate changes in the ankle joint in patients of JIA by contrast-enhanced MRI. We aim to quantify these changes using the MRI score and correlate them with clinical-based disease activity scores.
MATERIAL AND METHODS
It is a cross-sectional observational study comprising 26 patients, studied over a span of 6 months. The study was conducted in the radiology department of a government hospital.
The patients included in the study were referred from the rheumatology unit of the department of pediatrics. Patients <16 years of age of either sex with a clinical diagnosis of JIA with pain and swelling in the ankle joint were included in the study [Figure 1].

- Image of the left ankle joint shows swelling at the ankle joint (red arrow).
For the study, JIA has been defined as arthritis (meaning joint swelling or effusion or two of the following, that is, limitation of joint motion, tenderness, and warmth, not due to previous mechanical disorder or other identifiable causes) in a child of <16 years of age and persisting beyond six weeks and after excluding other causes of chronic arthritis based on American College of Rheumatology Clinical criteria for each of these illnesses.
Informed consent was obtained from parents or guardians of children.
A detailed predesigned pro forma was collected for each patient, which included the clinical status of the patient based on disease activity scores, namely the JADAS-27, Swelling score, tenderness Score, and ESR of the patient at the time of the study, as assessed by the rheumatologist.[8] All clinically diagnosed cases of JIA shall be subjected to MRI evaluation on Siemens Skyra 3Tesla High-Resolution MR system using a dedicated coil for the ankle joint. The following sequences were obtained sagittal/coronal/axial PD fat-saturated images, sagittal/axial/coronal T1 weighted fat-suppressed images before and after the contrast, sagittal T2-weighted image, and 3dimensional double echo steady state (DESS) sequence to evaluate the cartilage.[9]
Six sub-joints on each side were evaluated for every enrolled patient – tibiotalar joint, subtalar joint, calcaneocuboid joint, calcaneo-navicular joint, naviculo-cuneiform joint, and tarsometatarsal joints. Four parameters were assessed and graded as per the Juvenile Arthritis MRI Score (JAMRIS) [Table 1].[9]
| Synovial hypertrophy | Grade | Bone edema | Grade |
| <2 mm | 0 | None | 0 |
| 2-4 mm | 1 | <10% | 1 |
| >4 mm | 2 | 10-25% | 2 |
| >25% | 3 | ||
| Minimum Score: 0 Maximum Score: 12 |
Minimum Score: 0 Maximum Score: 18 |
||
| Cartilaginous lesions | Grade | Bone erosions | Grade |
| <2 mm | 0 | <2 mm | 0 |
| 2-4 mm | 1 | 2-4 mm | 1 |
| >4 mm | 2 | >4 mm | 2 |
| Minimum Score: 0 Maximum Score: 12 |
Minimum Score: 0 Maximum Score: 12 |
Synovial hypertrophy is defined as the enhancement of the thickened synovium (>2 mm). The enhancement is judged by comparison between T1-weighted images obtained before and after intravenous gadolinium contrast administration.[10] Synovial hypertrophy is scored semiquantitatively based on the maximal thickness on any given slice at each sub-joint.
The cartilage loss is viewed on the 3D DESS sequence as areas of superficial loss/thinning or deep loss to the subchondral bone, estimated as the percentage of involved surface area at each sub-joint.[10]
Bone erosion is defined as the loss of normal low signal intensity of subchondral cortical bone and loss of normal high signal intensity of the trabecular bone on T1-weighted images, with an estimated percentage of involved bone volume at each site.[10]
Bone marrow changes were defined as lesions within the trabecular bone, with ill-defined margins and high signal intensity on T2-weighted fat-saturated images and low signal intensity on T1-weighted images.[10]
Other findings, such as tenosynovitis, joint effusions, and enthesitis, were also recorded [Figures 2-5].
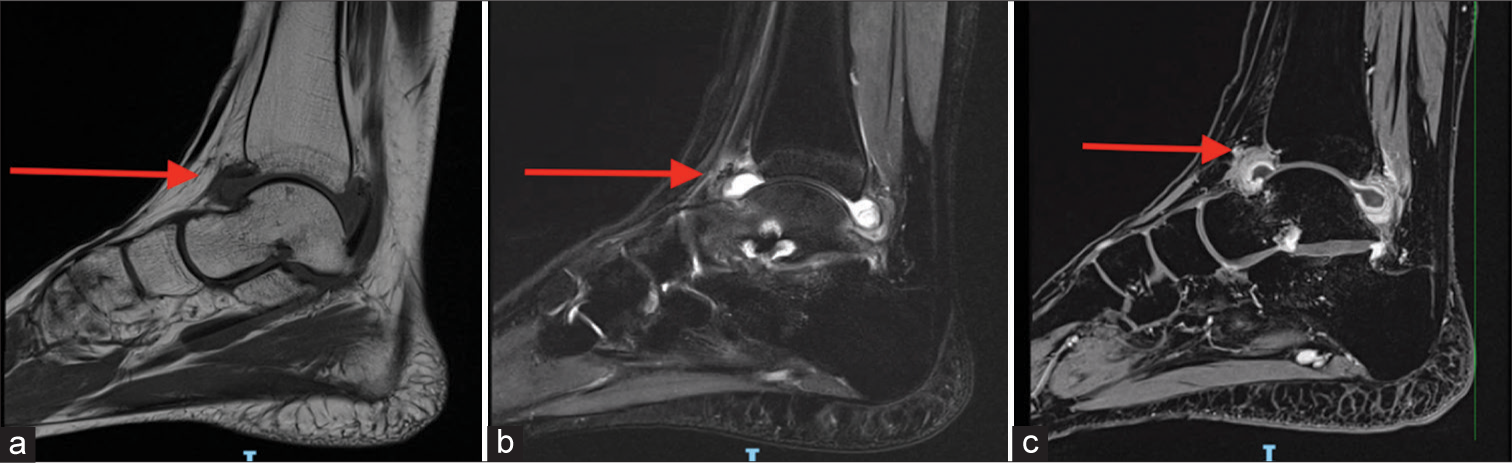
- (a) T1 sagittal image of the tibiotalar joint shows moderate synovial thickening (red arrow). (b) In the T2w image, there is a T2-hyperintense signal visualized at the tibiotalar joint suggesting joint effusion (red arrow). (c) On post-contrast T1w image, there is homogeneously enhancing thickening of the tibiotalar joint synovium in keeping with synovitis (red arrow). The non-enhancing portion is the joint fluid.
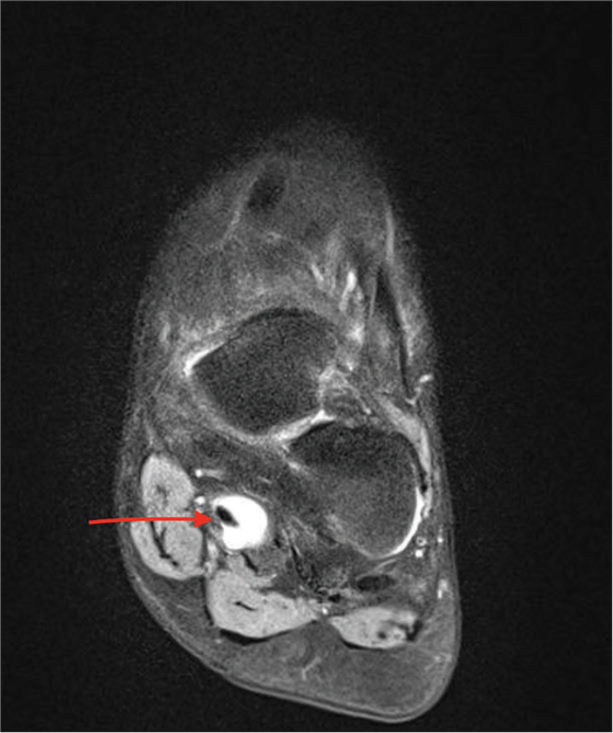
- T2 axial image of the left foot describes increased fluid signal intensity around the flexor hallucis longus tendon in keeping with tenosynovitis (red arrow).

- (a) Sagittal PD fat-suppressed (FS) of the ankle joint in a k/c/o JIA depicts marrow edema (long red arrow) and subarticular erosions (short red arrow). (b) Cor T1W FS post contrast-enhanced images of the ankle joint in a k/c/o Juvenile Idiopathic Arthritis depicts subarticular erosions (superior red arrow) as well as synovial enhancement and thickening (inferior red arrow) involving predominantly the talonavicular joint of the ankle.
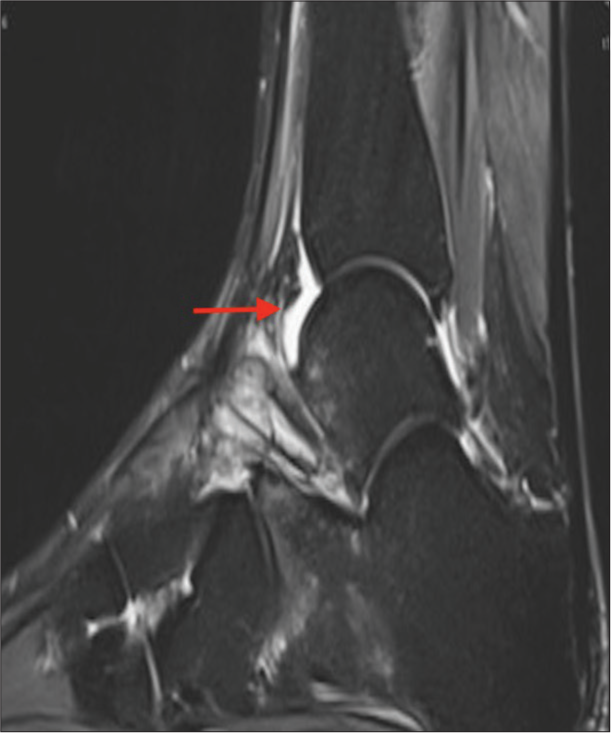
- Short tau inversion recovery sagittal image showing tibiotalar joint effusion (red arrow).
RESULTS
The data collected were analyzed by SPSS version 16.0 software. Correlation of various MRI parameters such as synovial hypertrophy, bone marrow edema, bone erosions, and cartilaginous lesions, and the total MRI score with the clinical score was done using Spearman’s correlation. For all statistical tests, a P < 0.05 was taken to indicate a significant difference. The youngest child to be included in the study was 5 years old, and the eldest was 16 years old. About 61.5% (16/26) were males and 38.4% (10/26) were females. About 11 (42.3%) were SOJIA, and 3 (11.5%) were ERA. Oligoarthritis, polyarthritis, and undifferentiated type of JIA accounted for 15.3% each, with four cases belonging to each subset.
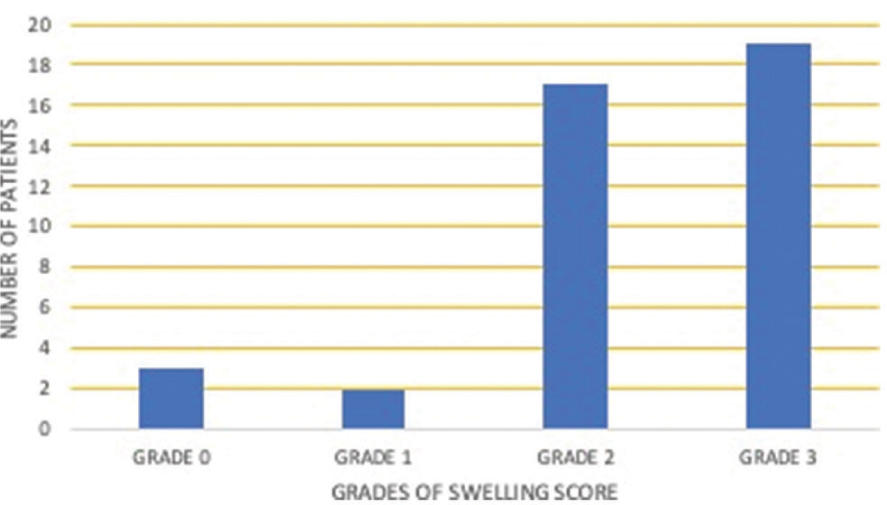
The highest JADAS-27 score recorded was 26.6, and the lowest was seven. The mean ESR value of the study population is 31.7, the highest being 100 and the lowest being six. About 56% (23/41) of ankle joints evaluated showed Grade 2 on the tenderness score [Table 2]. About 46% (19/41) of ankle joints evaluated showed Grade 3 on the swelling score [Table 3].
 |
 |
Among all, the tibiotalar joint is the most commonly and most severely affected joint.
At the tibiotalar joint, seven ankle joints showed Grade 2 synovial hypertrophy and five patients showed Grade 3 synovial hypertrophy. About 19 cases showed bone edema, of which four cases are Grade 3. Seven joints show cartilage lesions, but only two are Grade 3. Seven joints showed bone erosions. Only one case showed Grade 3 erosion.
At the subtalar joint, only three cases revealed hypertrophied synovium; only one was Grade 3. About 11 cases show bone edema, of which only four are Grade 3. Four joints show cartilage lesions, but none of them is Grade 3. Six cases showed erosions. None of them showed Grade 3 erosions.
At the calcaneocuboid joint, five joints showed synovial hypertrophy, and only one was Grade 3. About 12 cases show bone edema, of which four are Grade 3. About eight joints show cartilage lesions but only two are Grade 3.
About 9 cases showed bone erosions, of which only one was Grade 3.
At the talonavicular joint, five joints showed synovial hypertrophy and only one was Grade 3. About 17 cases showed bone edema, of which only one is Grade 3. Seven joints show cartilage lesions but only one is Grade 3. Four cases showed erosions.
At the naviculocuneiform joint, six joints showed synovial hypertrophy and only one was Grade 3. About 17 cases showed bone edema, of which two are Grade 3. Five joints show cartilage lesions but only one is Grade 3. Five cases showed erosions.
At the tarsometatarsal joints, three joints showed synovial hypertrophy. About 14 cases show bone edema, of which six are Grade 3. Seven joints show cartilage lesions but only two are Grade 3. Nine joints revealed bone erosions, of which two of them were Grade 3.
Tenosynovitis of the anterior, posterior, or lateral compartment tendons was observed in eight ankle joints. The tibialis posterior was the most commonly involved tendon. Enthesitis was reported in 17 studies, joint effusion was reported in 11, tenosynovitis in 8, and medullary infarcts in one ankle.[11]
On statistical evaluation, a positive correlation between the JADAS-27 score and the total MRI score, with a P-value being 0.03, has been observed [Figure 6].
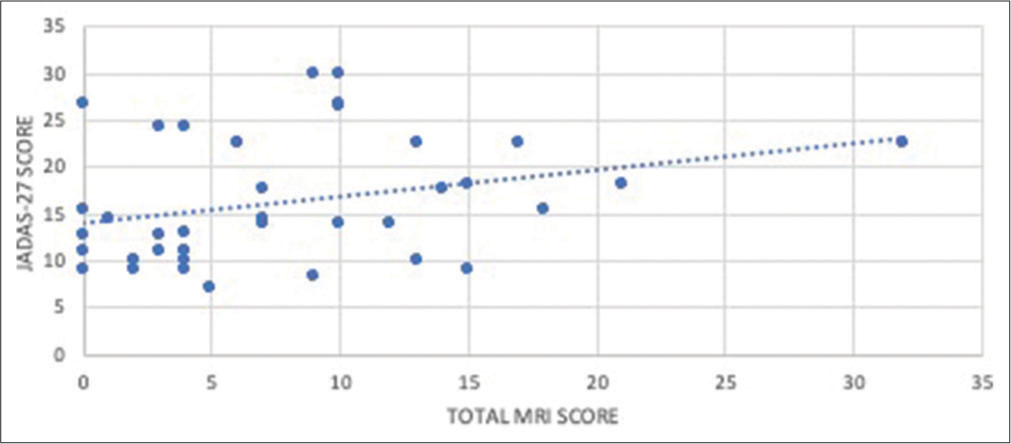
- Correlation between the Juvenile Arthritis Disease Activity Score-27 (JADAS-27) score and the total magnetic resonance imaging (MRI) score, which shows that there is a positive correlation between the JADAS-27 score and the total MRI score with a P-value being 0.03.
The bone marrow edema also showed a positive correlation with the ESR value of the patient, with the P-value being 0.03 [Figure 7].
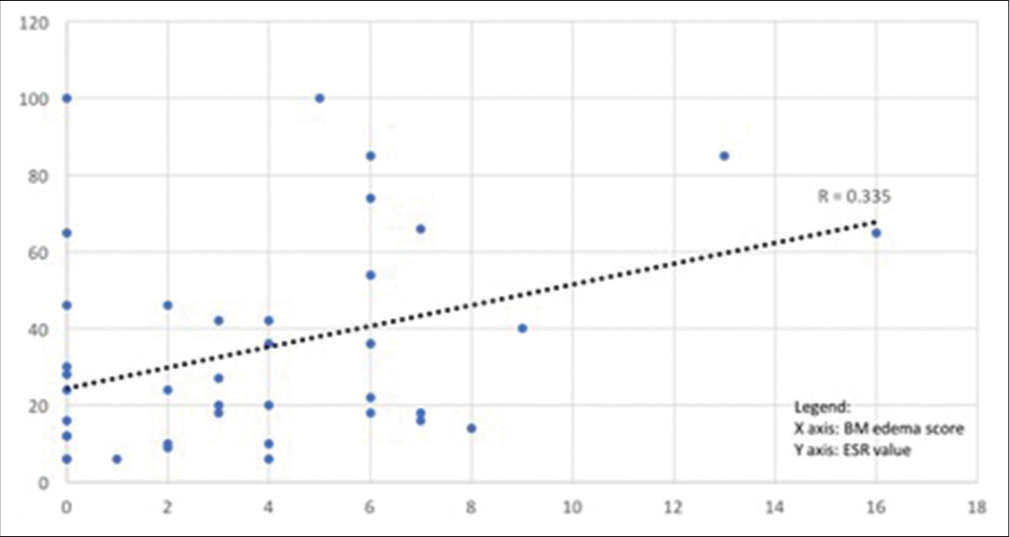
- Correlation between bone marrow edema score and erythrocyte sedimentation rate (ESR)-the bone marrow edema also showed a positive correlation with the ESR value of the patient, P-value being 0.03.
DISCUSSION
The prevalence of JIA is estimated to be 1.25/1000 children in India.[12]
The non-invasive nature of MRI, its multiplanar reconstruction capabilities, and excellent soft-tissue assessment make it especially valuable for the detection and assessment of a variety of disorders involving the tendons, cartilage, and synovium.[13]
The JAMRIS was originally devised for the knee joint to quantify changes and define the level of disease activity in the affected joint. This study has used this JAMRIS score to evaluate changes in the ankle.[14]
The positive correlation between JADAS-27 and total MRI score indicates that MRI score is directly proportional to the level of disease activity in the body. The bone marrow edema score and ESR of the patient also show a linear relationship.[15]
This is a novel study where the ankle joint has been studied for evaluating changes in JIA, hence there are no standard cutoff values available for the ankle joint differentiating normal from pathological in the pediatric population for imaging parameters. It was realized that it would have been appropriate to have used age-matched healthy controls for comparison to ensure that all MRI findings were not deemed pathological, as growing bones may also contribute to bony depressions or marrow changes that may be taken as abnormal in JIA patients. However, it could not be done because of the ethical reason of giving contrast to healthy children.
The study would have been more objective if the ankles of healthy controls were studied simultaneously for comparison, but this could not be accomplished because it is not ethically feasible to give contrast to healthy children. It is challenging to define disease remission on imaging as well as clinically. Newer techniques, such as quantification of flow through the synovium through dynamic contrast MRI, are being studied, but no standardized data is available for the same.[16] Since this is a single institution study and the sample size is also relatively small, it is also recognized as a limitation of this study.
MRI is the gold standard in assessing the disease activity in patients with JIA, including the detection of synovitis, marrow edema, and inflammation of the tendon sheath. It provides an objective and precise assessment of disease status in comparison to the clinical examination.[17]
MRI can detect the disease before it becomes evident on X-ray. Moreover, it can localize the exact site of maximum joint cavity inflammation for targeted steroid injections.[18]
CONCLUSION
MRI is the pioneer investigation for musculoskeletal disorders and provides a reproducible and accurate assessment of the patient’s disease activity. The authors suggest the use of MRI as an objective scoring system for this disease entity as it correlates with the clinical evolution, and the clinical scoring has some subjective elements.
Acknowledgment
I would like to extend my heartfelt gratitude and sincerely acknowledge the efforts of all radiographers and the support staff who guided me and helped me to carry out my research smoothly.
Ethical statement
The research/study is approved by the Institutional Ethics Committee at RML Hospital, number TP(MD/MS)(107/2017)/ IEC/PGIMER/RMLH 1757/17 dated 30th October 2017.
Declaration of patient consent
Patient’s consent not required as patient’s identity is not disclosed or compromised.
Conflicts of interest
There are no conflicts of interest.
Use of artificial intelligence (AI)-assisted technology for manuscript preparation
The authors confirm that there was no use of artificial intelligence (AI)-assisted technology for assisting in the writing or editing of the manuscript, and no images were manipulated using AI.
Financial support and sponsorship
Nil.
References
- Imaging of juvenile idiopathic arthritis. Part I: Clinical classifications and radiographs. J Ultrason. 2016;16:225-36.
- [CrossRef] [PubMed] [Google Scholar]
- The joints in juvenile idiopathic arthritis. Insights Imaging. 2015;6:275-84.
- [CrossRef] [PubMed] [Google Scholar]
- Do patients with juvenile idiopathic arthritis in remission exhibit active synovitis on joint ultrasound? Rheumatol Int. 2014;34:937-45.
- [CrossRef] [PubMed] [Google Scholar]
- Development and preliminary validation of a paediatric-targeted MRI scoring system for the assessment of disease activity and damage in juvenile idiopathic arthritis. Ann Rheum Dis. 2011;70:440-6.
- [CrossRef] [PubMed] [Google Scholar]
- Using the juvenile arthritis disease activity score based on erythrocyte sedimentation rate or C-reactive protein level: Results from the portuguese register. Arthritis Care Res (Hoboken). 2014;66:585-91.
- [CrossRef] [PubMed] [Google Scholar]
- Imaging of juvenile idiopathic arthritis. Part II: Ultrasonography and MRI. J Ultrason. 2016;16:237-51.
- [CrossRef] [PubMed] [Google Scholar]
- Remission, minimal disease activity, and acceptable symptom state in juvenile idiopathic arthritis: Defining criteria based on the juvenile arthritis disease activity score. Arthritis Rheum. 2012;64:2366-74.
- [CrossRef] [PubMed] [Google Scholar]
- Reliability and responsiveness of the juvenile arthritis MRI scoring (JAMRIS) system for the knee. Eur Radiol. 2013;23:1075-83.
- [CrossRef] [PubMed] [Google Scholar]
- OMERACT rheumatoid arthritis magnetic resonance imaging studies. Core set of MRI acquisitions, joint pathology definitions, and the OMERACT RA-MRI scoring system. J Rheumatol. 2003;30:1385-6.
- [Google Scholar]
- Wrist and ankle MRI of patients with juvenile idiopathic arthritis: Identification of unsuspected multicompartmental tenosynovitis and arthritis. AJR Am J Roentgenol. 2014;202:413-7.
- [CrossRef] [PubMed] [Google Scholar]
- MRI of rheumatoid arthritis image quantitation for the assessment of disease activity, progression and response to therapy. Rheumatology (Oxford). 2008;47:13-21.
- [CrossRef] [PubMed] [Google Scholar]
- Quantitative MR characterization of disease activity in the knee in children with juvenile idiopathic arthritis: A longitudinal pilot study. Pediatr Radiol. 2007;37:535-43.
- [CrossRef] [PubMed] [Google Scholar]
- Do patients with juvenile idiopathic arthritis in clinical remission have evidence of persistent inflammation on 3T magnetic resonance imaging? Arthritis Care Res (Hoboken). 2012;64:1846-54.
- [CrossRef] [PubMed] [Google Scholar]
- Magnetic resonance imaging of the knee joint in juvenile idiopathic arthritis. Reumatologia. 2020;58:416-23.
- [CrossRef] [PubMed] [Google Scholar]
- Selecting magnetic resonance imaging (MRI) outcome measures for juvenile idiopathic arthritis (JIA) clinical trials: First report of the MRI in JIA special interest group. J Rheumatol. 2013;41:354-8.
- [CrossRef] [PubMed] [Google Scholar]
- Evidence-based outcomes of studies addressing diagnostic accuracy of MRI of juvenile idiopathic arthritis. AJR Am J Roentgenol. 2009;192:1209-18.
- [CrossRef] [PubMed] [Google Scholar]


