
Translate this page into:
Gaucher disease: A review of MSK MRI protocol and peripheral skeletal MRI findings

*Corresponding author: Arleen Aziz, Department of Diagnostic, Molecular and Interventional Radiology, Icahn School of Medicine at Mount Sinai, New York, United States. Arleen.aziz@mountsinai.org
-
Received: ,
Accepted: ,
How to cite this article: Husain R, Aziz A, Corcuera-Solano I, Simpson W, Huang M, Dayan E. Gaucher disease: A review of MSK MRI protocol and peripheral skeletal MRI findings. Indian J Musculoskelet Radiol. 2024;6:3-9. doi: 10.25259/IJMSR_57_2023
Abstract
Gaucher disease (GD) is the most common autosomal recessive lysosomal storage disorder. It results from a glucocerebrosidase deficiency, causing deposition of undegraded glucosylceramide, predominantly in the reticuloendothelial system. The purpose of this article is to detail our institution’s magnetic resonance imaging (MRI) protocol for GD, review its axial and appendicular skeletal MRI characteristics, and suggest clinically relevant radiology reporting tips.
Keywords
Gaucher disease
Lysosomal storage disorder
Magnetic resonance imaging
Bone marrow burden score

INTRODUCTION
Gaucher disease (GD), though rare overall, is the most common autosomal recessive lysosomal storage disorder. Glucocerebrosidase deficiency causes accumulation of glucosylceramide in the reticuloendothelial system, particularly the bone marrow, liver, and spleen.[1-5] Common manifestations include bone marrow infiltration and hepatosplenomegaly.[1-4] The former can cause abnormalities such as anemia, thrombocytopenia, and skeletal deformities.[1,5-7] There are three types of GD. Type 1 is the most common in the United States and does not involve the brain or spinal cord. Type 2, also known as acute infantile neuropathic GD, results in infant death. Type 3 is the most common variant worldwide and does involve the nervous system.
Skeletal involvement comprises the greatest morbidity for GD patients.[1,8] Although diffuse involvement is most common, there are focal manifestations as well. Diffuse bone marrow involvement interrupts bone remodeling, resulting in osteopenia/osteoporosis and bone marrow infiltration. Focal manifestations include osteonecrosis, osteomyelitis, fractures, and lytic bone lesions.[1,8] Of note, young individuals may also face growth retardation.[8] Although an array of imaging modalities can assess the musculoskeletal manifestations of GD, magnetic resonance imaging (MRI) is the imaging modality of choice given its superiority in evaluating the bone marrow,[9] with the added benefit of no radiation as patients get repeated imaging to assess for initiation of treatment and to monitor treatment response.
In efforts to standardize MRI evaluation of GD’s skeletal involvement, the bone marrow burden (BMB) score was first proposed in 2003 by Maas et al.[10] The BMB score is calculated by adding three scores: T1 signal intensity, T2 signal intensity, and sites of involvement/infiltration pattern [Table 1]. A total BMB score of up to 8 could be given for the femora and lumbar spine each. Hence, a total BMB score of up to 16 could be obtained by adding the lumbar and femoral BMB scores. If the BMB score is reported for the femora only, it is referred to as a modified BMB score. The interpretation of the BMB score is straightforward: high scores represent more severe bone marrow involvement.[11,12] Figures 1-4 are cases of GD with various BMB scores. Thus, it is paramount in tracking disease severity and assessing treatment response. Other benefits include reproducibility, low cost, and wide availability. A disadvantage is that it is only semi-quantitative.
| Femurs | |||
| Score | T1 signal intensityb | T2 signal intensityb | Sites of involvement |
| 0 | Slightly hyperintense/isointense | Isointense | |
| 1 | Slightly hypointense | Slightly hyperintense/hypointense | Diaphysis |
| 2 | Hypointense | Hyperintense/hypointense | Proximal epiphysis/apophysis |
| 3 | Mixed type | Distal epiphysis | |
| Lumbar spine | |||
| Score | T1 signal intensityc | T2 signal intensityc | Infiltration pattern |
| 0 | Slightly hyperintense | Isointense | |
| 1 | Isointense | Slightly hyperintense/hypointense | Patchy |
| 2 | Slightly hypointense | Hyperintense/hypointense | Diffuse |
| 3 | Hypointense | Involvement of fat surrounding the basivertebral veins | |
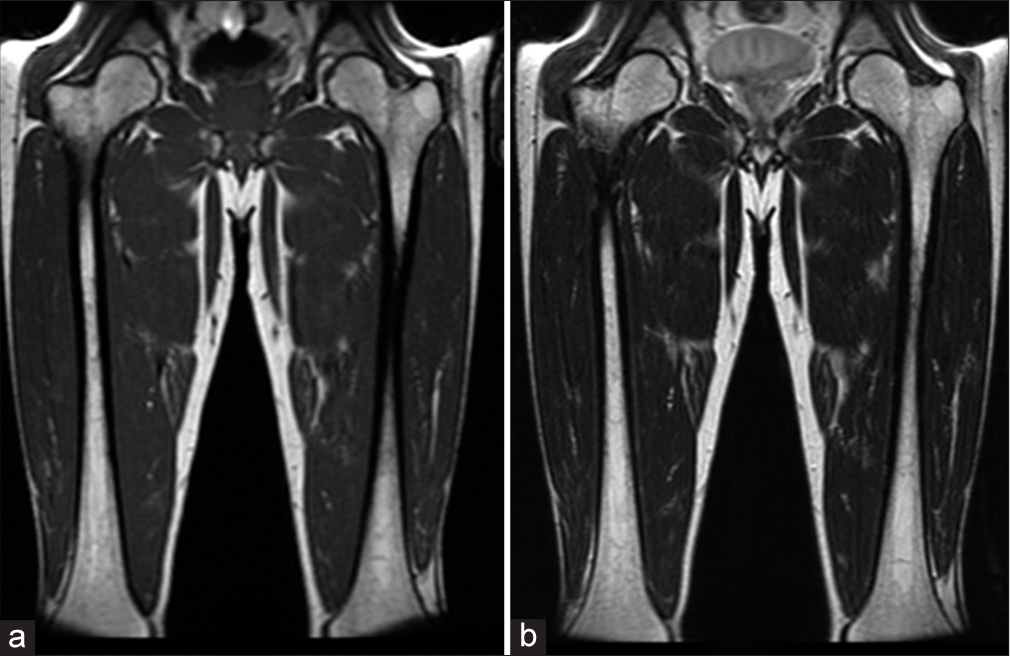
- A 48-year-old male. (a) Coronal T1-weighted and (b) T2-weighted images demonstrate scattered areas of slight hypointensity involving bilateral femoral medullary cavities. Bone marrow burden score 3: T1: 1, T2: 1, Site: 1.
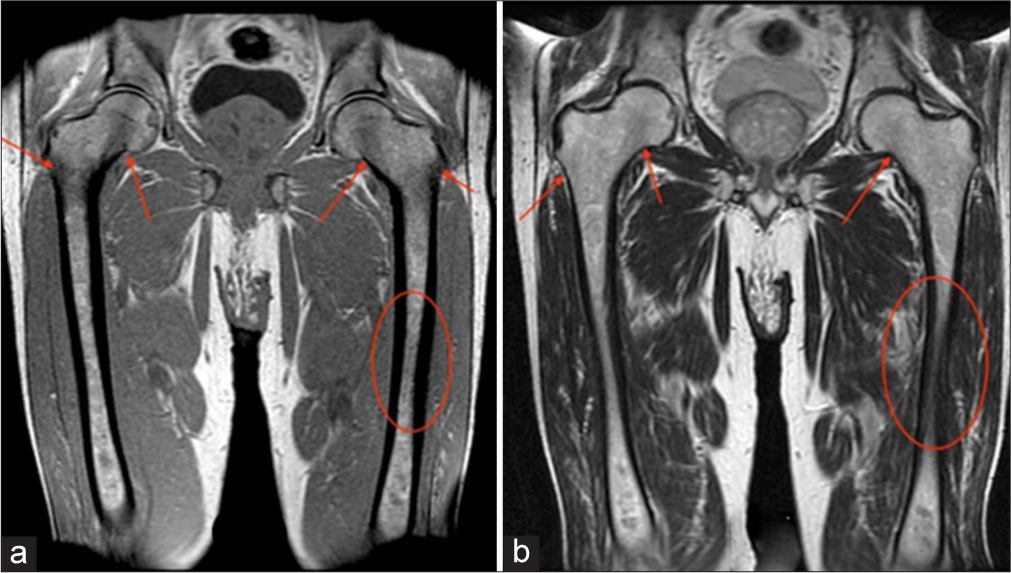
- A 58-year-old male. (a) Coronal T1-weighted and (b) T2-weighted images demonstrate slight hypointensity of the bilateral femoral necks/diaphyses (ovals), as well as, the intertrochanteric regions and greater trochanters (arrows). Bone marrow burden score 4: T1: 2, T2: 1, Site: 2.
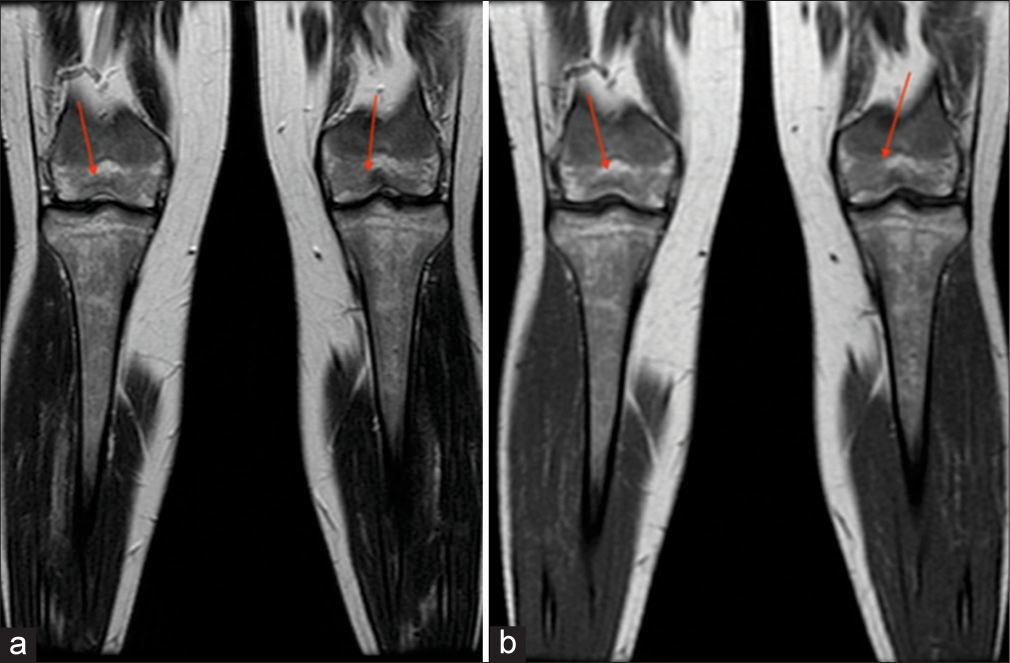
- A 30-year -old female. (a) Coronal T1-weighted and (b) T2-weighted images demonstrate hypointensity of bilateral distal femoral epiphyses (arrows). Bone marrow burden score 7: T1: 2, T2: 2, Site: 3.
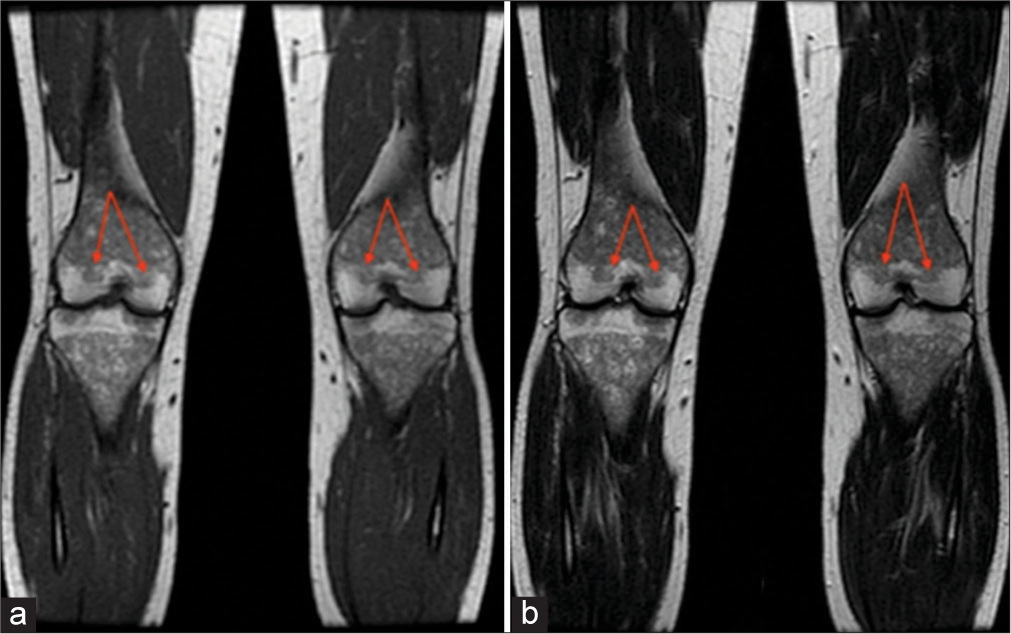
- A 41-year-old female. (a) Coronal T1-weighted and (b) T2-weighted images demonstrate hypointensity of bilateral distal femoral epiphyses (arrows). Bone marrow burden score 7: T1: 2, T2: 2, Site: 3.
Before the advent of the BMB score, the Dixon quantitative chemical shift imaging (QCSI) technique was used to measure the displacement of fatty marrow by Gaucher cells. The advantage of QCSI is in its name – it generates a quantitative measurement of marrow fat. However, due to its complexity, QCSI is not available at all imaging sites. Although it is more sensitive than the BMB score,[11] the latter demonstrates enough sensitivity to detect bone marrow response to enzyme supplementation therapy.[11,12]
This article outlines our institution’s GD MRI Protocol (which reflects the BMB scoring system) and aptly highlights peripheral skeletal MRI characteristics, as well as clinically relevant radiology reporting tips.
INSTITUTION MRI PROTOCOL
The BMB score can be applied to coronal T1 and T2 sequences of the femora and/or sagittal T1 and T2 sequences of the lumbar spine. Our institution utilizes the former; thus, our GD MRI protocol involves coronal T1, T2, short-tau inversion recovery (STIR), and in-phase and opposed-phase (IP-OP) sequences of the femora and proximal tibiae/fibulae. Images of the proximal tibiae/fibulae are obtained to ensure adequate assessment of the distal femora since these regions can be distorted by the large field of view sequences of the femora.
The grading system of the BMB score interprets the bone marrow signal with respect to subcutaneous fat. While interpreting MRI, it is important to keep in mind that the signal changes in GD are typically low in signal on T1- and T2-weighted sequences except for severe cases where the signal can be mixed, especially on T2. The less common high-signal changes on T2 or STIR are thought to be secondary to acute complications such as bone infarction or bone crisis.[11] STIR sequence is not formally part of the BMB scoring system and shows slight hyperintensity corresponding to marrow infiltration or red marrow reconversion.[8] Normal yellow (fatty) marrow appears low in signal on STIR, as is often seen in the epiphyses and epiphyseal equivalents. IP-OP sequence is also not part of the BMB scoring system, although it can be useful to differentiate red marrow from a marrow infiltrating process, with the former showing a drop in signal on the OP due to microscopic fat.[13] The degree of signal drop in OP is typically 20% or greater at 1.5T and 25% or greater on 3T MRI.[14,15] Figure 5 is a sample of the GD report.[11]
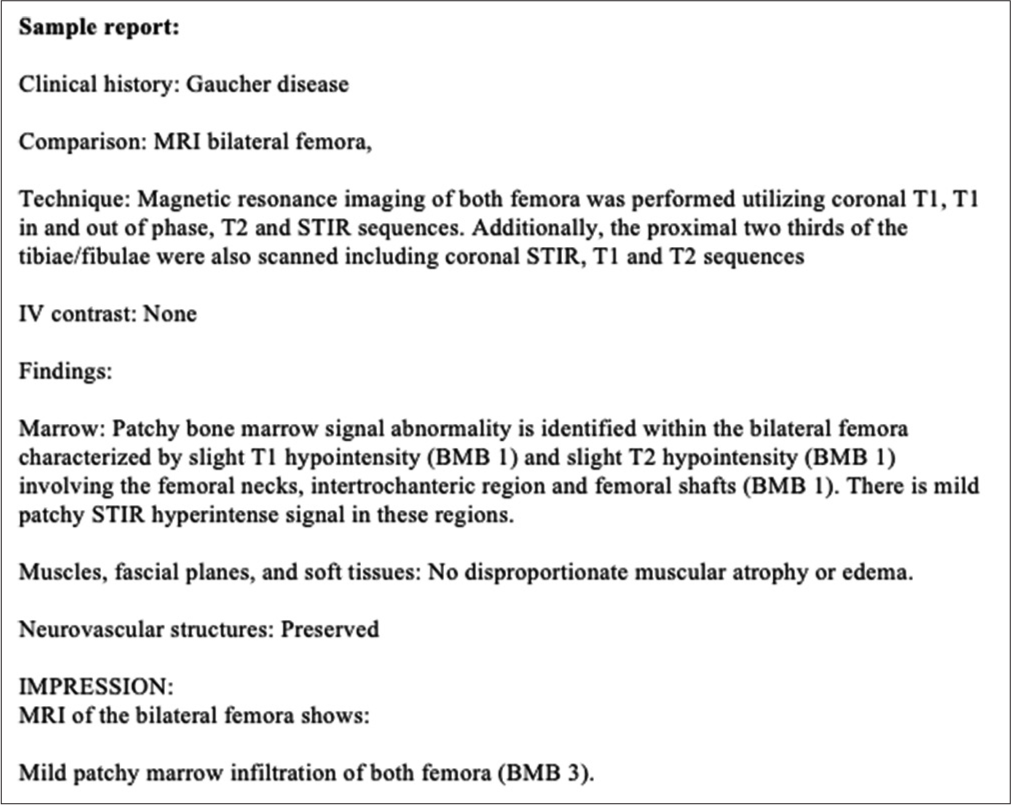
- Sample Gaucher disease radiology report. Maas M, Van Kuijk C, Stoker J, Hollak CE, Akkerman EM, Aerts JF, et al. Quantification of bone involvement in Gaucher disease: MR imaging bone marrow burden score as an alternative to Dixon quantitative chemical shift MR imaging-initial experience. Radiology 2003;229:554-61.
PERIPHERAL SKELETAL MRI FINDINGS
Diffuse
Osteopenia/osteoporosis
GD patients of all ages are prone to decreased bone mineral density, which can be assessed with dual-energy X-ray absorptiometry. These reductions are classified as osteopenia or osteoporosis based on severity, with the latter being more severe. This complication is most prevalent in post-splenectomy patients.[1,5,8] Regions at greatest risk are the lumbar spine, femoral neck, femoral trochanters, tibia, and distal radius. Fortunately, osteopenia/osteoporosis can be reversed with enzyme replacement therapy. Prompt treatment leads to better outcomes, highlighting the importance of imaging in aiding early diagnosis.[16]
Bone marrow infiltration
Gaucher cells directly accumulate in the bone marrow. This infiltration initially involves the axial skeleton, followed by centrifugal involvement of the appendicular skeleton. Thus, the humerus and femur are commonly involved, while the epiphysis and apophysis are spared except in the most severe cases. This pattern is the reverse of the typical conversion of red to yellow marrow that occurs from childhood to adulthood. On MRI, bone marrow infiltration presents as T1 and T2 hyperintense yellow marrow getting replaced by T1 and T2 hypointense abnormal bone marrow.[1,8,9] The evaluation of bone marrow infiltration in children is complicated by the fact that they have a greater concentration of red marrow, which is T1 and T2 hypointense, as well. The presence of an Erlenmeyer flask deformity can help clarify this dilemma [Figure 6]. Although not specific to Gaucher’s disease, it has been reported in 44–61% of patients.[6,17,18] The deformity, due to under-tubulation of the distal meta-diaphysis of the distal femur, implies bone marrow involvement in childhood when the skeleton is developing. Once the deformity occurs, it persists into adulthood.
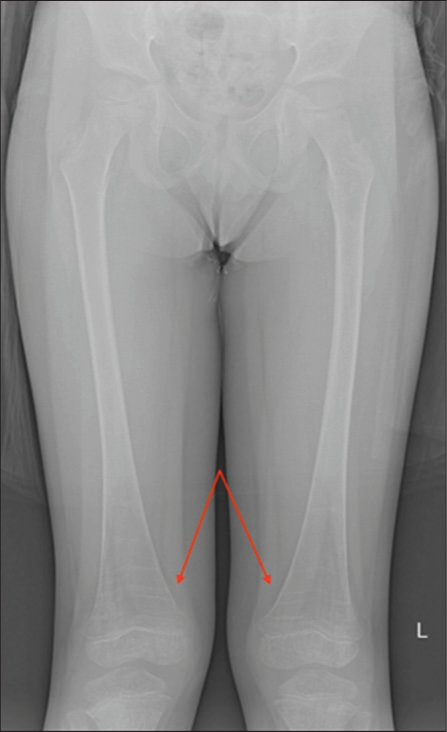
- Erlenmeyer flask deformity. A 6-year-old male. AP radiograph of the bilateral femurs demonstrates the Erlenmeyer flask deformity (arrows) which results from undertubulation of the distal meta-diaphysis of the distal femur and implies bone marrow involvement in children with Gaucher’s disease.
On STIR sequences, bone marrow infiltration is slightly hyperintense. Like T2, STIR is a fluid-sensitive sequence that suggests marrow edema and the presence of an “active” process such as osteomyelitis or osteonecrosis. On the other hand, IP-OP sequences are most helpful in identifying microscopic fat content by showing signal intensity drop on OP images compared to IP images. Expansion of the medullary cavity due to bone marrow infiltration by Gaucher cells can appear hypointense on OP images. Like osteopenia/osteoporosis, bone marrow infiltration can be reversed with enzyme replacement therapy.[1,8,19]
Focal
Osteonecrosis
As glucosylceramide accumulates in the bones of GD patients, mounting intraosseous pressure can cause vaso-occlusion and resultant osteonecrosis.[1,8,20,21] Other risk factors include splenectomy, male gender, thrombocytosis, and another focus on osteonecrosis.[5,20]
Osteonecrosis can occur in either the corticocancellous bone or the medullary cavity of bones. The former is most common in the humeral and femoral heads, femoral condyles, and tibial plateaus. By contrast, medullary osteonecrosis, often referred to as medullary infarct, is often asymptomatic.
Clinically, osteonecrosis can be indistinguishable from osteomyelitis. In both diseases, patients may present with fever, swelling, pain, tenderness, and disability.[5,12] Fortunately, MRI can aid in differentiating the two entities which require different treatments. While both may present as edema seen as T2 hyperintensity in the acute setting, progression of osteonecrosis will present as geographic serpiginous signal change outlining the dead bone with or without surrounding marrow edema-like signal[8] [Figures 7-9]. In advanced cases, the articular surface can collapse and undergo secondary degenerative change, which mandates joint replacement. In addition, fractures or sub-periosteal hemorrhage can result.[1,21]
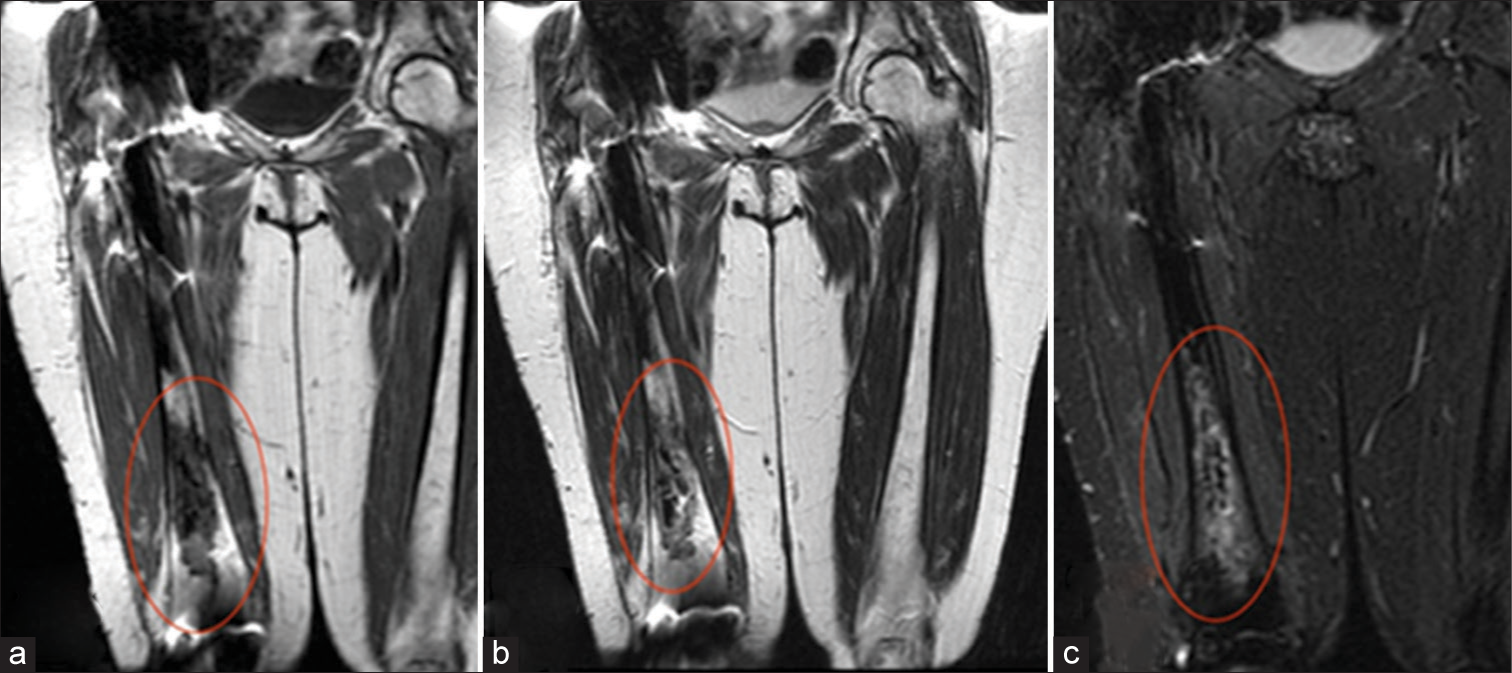
- Osteonecrosis. A 37-year-old female. (a) Coronal T1-weighted and (b) T2-weighted images demonstrate hypointensity of the right distal femoral diaphysis (ovals), corresponding to fibrosed and sclerosed bone marrow of chronic infarcted bone. (c) Coronal Short Tau Inversion Recovery (STIR) image demonstrates surrounding hyperintensity corresponding to reactive bone marrow edema and a serpiginous rim of hyperintensity representing granulation tissue (oval).
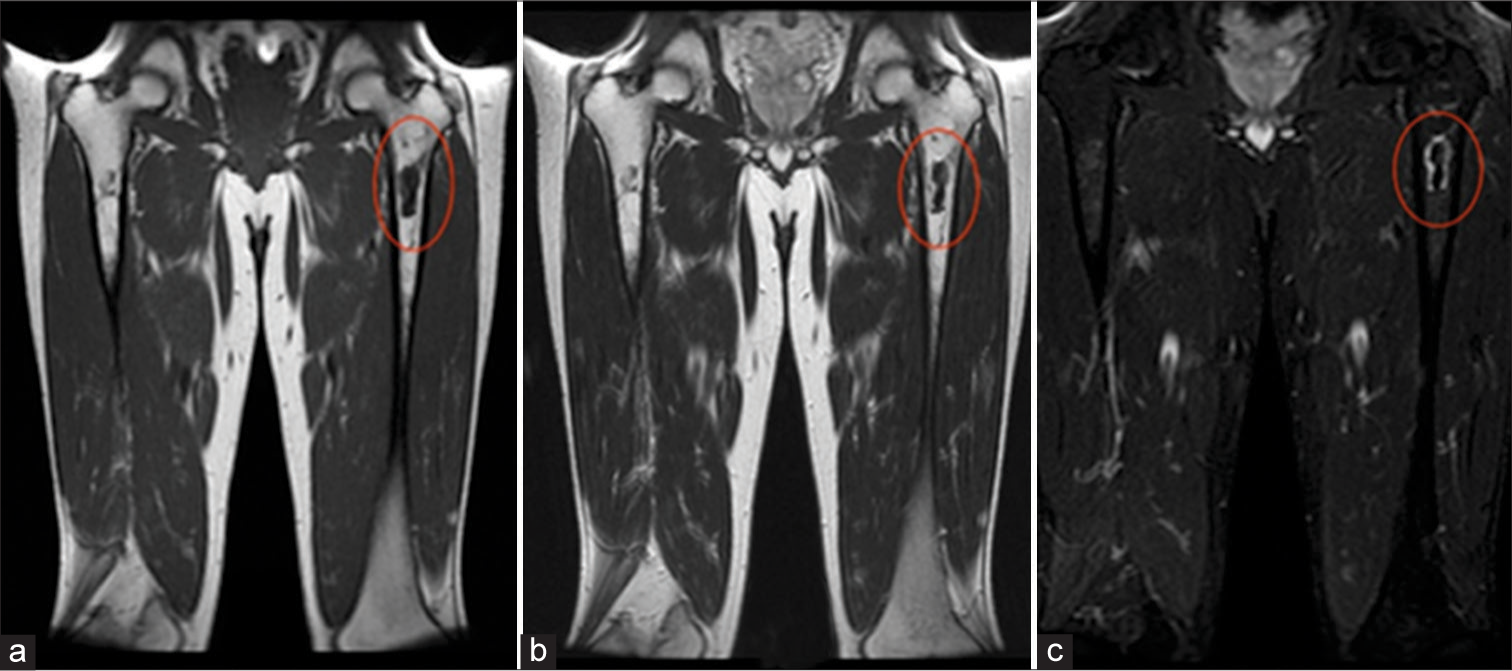
- Osteonecrosis. A 55-year-old male. (a) Coronal T1-weighted and (b) T2-weighted images demonstrate hypointensity of the left proximal femoral diaphysis (ovals), corresponding to fibrosed and sclerosed bone marrow of chronic infarcted bone. (c) Coronal Short Tau Inversion Recovery (STIR) image demonstrates serpiginous outer rim of hypointensity demarcating the border between living and necrotic bone, as well as, inner rim of hyperintensity representing granulation tissue (oval).
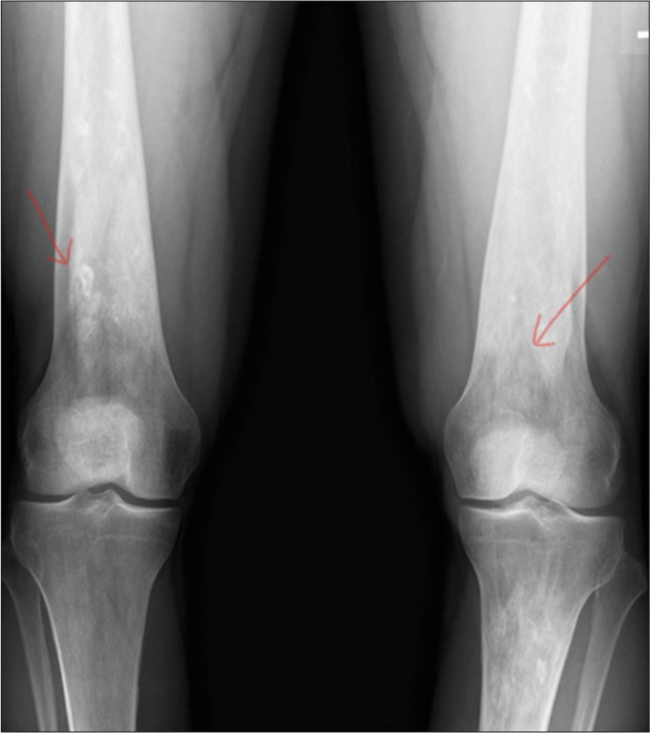
- Osteonecrosis. A 40-year-old male. AP radiograph of the bilateral femurs demonstrates serpiginous sclerosis (arrows) in the distal femurs, consistent with osteonecrosis in this patient with Gaucher’s disease.
Osteomyelitis
Infarcted bone can be complicated by superimposed infection. Although diseased bone can serve as a nidus for infection, pancytopenia remains the main risk factor for osteomyelitis in GD patients.[1] The mode of transmission is thought to be hematogenous. The following organisms are implicated most commonly: Staphylococcus aureus, Bacteroides, Group A – Hemolytic streptococcus, and Proteus mirabilis.[22,23]
MRI has high sensitivity and specificity for detecting osteomyelitis.[23-25] The first MRI feature of such is edema, occurring as early as 1–2 days and presenting as T1 hypointensity, T1 post-contrast hyperintensity, and T2 hyperintensity. An abscess would follow the same imaging pattern, with the addition of a thin rim of intermediate T1 signal intensity and T1 post-contrast hyperenhancement [Figure 10]. Chronic osteomyelitis can evolve into osteonecrosis (sequestrum) surrounded by a thick rind (involucrum). The sequestrum appears hypointense on all MRI sequences. Conversely, the involucrum can be isointense or edematous.[26] Eventually, an opening referred to as a “cloaca” may form at the involucrum to allow drainage of purulent and necrotic material from dead bone. The cloaca, thus, presents as a linear, fluid-filled continuation to surrounding soft tissue. If it extends to the skin surface, it is called a sinus tract.
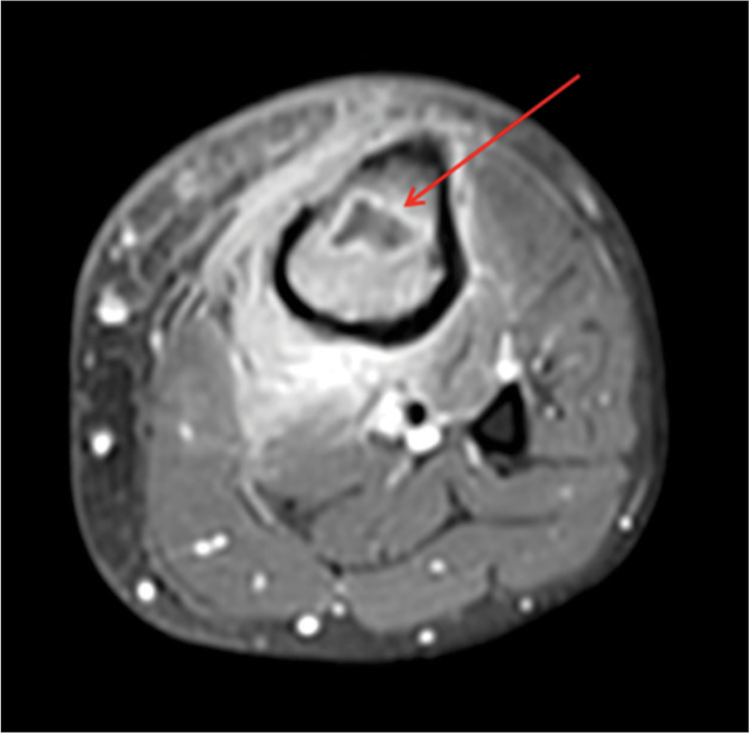
- Intraosseous abscess. A 26-year-old male. An axial T1-weighted post-contrast image demonstrating an intraosseous abscess (arrow). Hyperintense signal is noted within the surrounding subcutaneous tissue representing reactive subcutaneous edema and hyperemia.
Fractures
GD patients, including children, are prone to pathological fractures with poor healing due to a decrease in bone mineral density.[1,27,28] Clinical presentations include pain and physical disability. The most commonly affected site is the spine, followed by the lower extremities. Children tend to have more distal and displaced femoral neck fractures.[28]
Focal lytic lesions
GD can result in an increase in Cathepsin K, a biomarker for osteoclasts. Increased osteoclast activity expands the bony medulla and thins the cortex, which can result in endosteal scalloping, leading to the formation of focal lytic lesions called “Gaucheromas.” [1,29] These lytic lesions confer an increased risk of malignancy in GD patients, including multiple myeloma, lymphoma, sarcoma, and malignant epithelioid hemangioendothelioma.[30]
CONCLUSION
GD is the most common autosomal recessive lysosomal storage disorder. Skeletal involvement comprises the highest morbidity in these patients. Given MRI’s superiority in evaluating the bone marrow and lack of ionizing radiation, it remains the imaging modality of choice for GD, aiding in both the diagnosis and assessment of treatment responses.
Ethical approval
Institutional Review Board approval is not required.
Declaration of patient consent
Patient’s consent was not required as the patients identity is not disclosed or compromised.
Conflicts of interest
There are no conflicts of interest.
Use of artificial intelligence (AI)-assisted technology for manuscript preparation
The authors confirm that there was no use of artificial intelligence (AI)-assisted technology for assisting in the writing or editing of the manuscript and no images were manipulated using AI.
Financial support and sponsorship
Nil.
References
- The musculoskeletal manifestations of Gaucher’s disease In: European congress of radiology. 2010.
- [Google Scholar]
- Gaucher disease In: Metabolic aspects of chronic liver disease. New York: Nova Biomedical Books; 1992. p. :225.
- [Google Scholar]
- Gaucher disease: Complexity in a “simple” disorder. Mol Genet Metab. 2004;83:6-15.
- [CrossRef] [PubMed] [Google Scholar]
- Orthopaedic manifestations of Gaucher disease. Bull NYU Hosp Jt Dis. 2007;65:37-42.
- [Google Scholar]
- A review of Gaucher disease pathophysiology, clinical presentation and treatments. Int J Mol Sci. 2017;18:441.
- [CrossRef] [PubMed] [Google Scholar]
- The Gaucher registry: Demographics and disease characteristics of 1698 patients with Gaucher disease. Arch Intern Med. 2000;160:2835-43.
- [CrossRef] [PubMed] [Google Scholar]
- Imaging of non-neuronopathic Gaucher disease: Recent advances in quantitative imaging and comprehensive assessment of disease involvement. Insights Imaging. 2019;10:70.
- [CrossRef] [PubMed] [Google Scholar]
- Imaging and quantifying skeletal involvement in Gaucher disease. Br J Radiol. 2002;75(Suppl 1):A13-24.
- [CrossRef] [PubMed] [Google Scholar]
- Quantification of bone involvement in Gaucher disease: MR imaging bone marrow burden score as an alternative to Dixon quantitative chemical shift MR imaging-initial experience. Radiology. 2003;229:554-61.
- [CrossRef] [PubMed] [Google Scholar]
- Skeletal involvement in Gaucher's disease. Baillieres Clin Haematol. 1997;10:793-816.
- [CrossRef] [PubMed] [Google Scholar]
- In-phase and out-of-phase MR imaging of bone marrow: Prediction of neoplasia based on the detection of coexistent fat and water. AJR Am J Roentgenol. 1997;169:1439-47.
- [CrossRef] [PubMed] [Google Scholar]
- The Dixon technique for MRI of the bone marrow. Skeletal Radiol. 2019;48:1861-74.
- [CrossRef] [PubMed] [Google Scholar]
- Chemical shift imaging with in-phase and opposed-phase sequences at 3 T: What is the optimal threshold, measurement method, and diagnostic accuracy for characterizing marrow signal abnormalities? Skeletal Radiol. 2018;47:1661-71.
- [CrossRef] [PubMed] [Google Scholar]
- Pathogenesis of bone alterations in Gaucher disease: The role of immune system. J Immunol Res. 2015;2015:192761.
- [CrossRef] [PubMed] [Google Scholar]
- The use of confidence or fiducial limits illustrated in the case of the binomial. Biometrika. 1934;26:404-13.
- [CrossRef] [Google Scholar]
- Evaluation of bone infiltration of skull base in Gaucher disease. Mol Genet Metab. 2014;2:S26.
- [CrossRef] [Google Scholar]
- Radiological aspects of Gaucher disease. Skeletal Radiol. 2011;40:1505-13.
- [CrossRef] [PubMed] [Google Scholar]
- Bilateral femoral osteolytic lesions in a patient with type 3 Gaucher disease. Mol Genet Metab Rep. 2015;5:107-9.
- [CrossRef] [PubMed] [Google Scholar]
- Anaerobic osteomyelitis in patients with Gaucher's disease. Clin Infect Dis. 1992;15:771-3.
- [CrossRef] [PubMed] [Google Scholar]
- Osteomyelitis in Gaucher disease. J Bone Joint Surg Am. 1986;68:1380-8.
- [CrossRef] [PubMed] [Google Scholar]
- Gaucher disease-the orthopaedic aspect. Report of seven cases. Arch Orthop Trauma Surg. 1995;114:179-82.
- [CrossRef] [PubMed] [Google Scholar]
- The imaging of osteomyelitis. Quant Imaging Med Surg. 2016;6:184-98.
- [CrossRef] [PubMed] [Google Scholar]
- Interobserver variation in the detection of osteopenia by radiography and comparison with dual X-ray absorptiometry of the lumbar spine. Skeletal Radiol. 1994;23:195-9.
- [CrossRef] [PubMed] [Google Scholar]
- Risk factors for fractures and avascular osteonecrosis in type 1 Gaucher disease: A study from the International Collaborative Gaucher Group (ICGG) Gaucher Registry. J Bone Miner Res. 2012;27:1839-48.
- [CrossRef] [PubMed] [Google Scholar]
- Bone scans in the diagnosis of bone crisis in patients who have Gaucher disease. J Bone Joint Surg Am. 1991;73:513-7.
- [CrossRef] [PubMed] [Google Scholar]
- Gaucher disease and malignancy: A model for cancer pathogenesis in an inborn error of metabolism. Crit Rev Oncog. 2013;18:235-46.
- [CrossRef] [PubMed] [Google Scholar]


