
Translate this page into:
Hip potpourri: Unravelling the bone tumors around hip joint


*Corresponding author: Nivedita Chakrabarty, Department of Radiodiagnosis, Tata Memorial Centre, Advanced Centre for Treatment, Research and Education in Cancer, Homi Bhabha National Institute, Parel, Mumbai, Maharashtra, India. dr.niveditachakrabarty@gmail.com
-
Received: ,
Accepted: ,
How to cite this article: Chakrabarty N, Algeri RP, Sarmalkar MV. Hip potpourri: Unravelling the bone tumors around hip joint. Indian J Musculoskelet Radiol. 2025;7:54-64. doi: 10.25259/IJMSR_66_2024
Abstract
A variety of malignant and benign bone tumors arise from the pelvis and proximal femur; bones around the hip joint, and this area poses a unique challenge both for the radiologists and the surgeons/radiation oncologists. The accuracy of characterizing and diagnosing bone tumors of the appendicular skeleton, such as proximal femur, on radiographs, is excellent for experienced musculoskeletal onco-radiologists. However, when it comes to pelvic bones, accurately detecting a lesion on a radiograph itself becomes a challenge many-a-times, due to complex anatomy and overlying bowel gas shadows, and in such cases, we have to rely on cross-sectional imaging, particularly magnetic resonance imaging (MRI), for further evaluation. In addition to solving dilemmas regarding tumor characterization, MRI plays a pertinent role in providing the local staging for malignant bone tumors; essential for chalking out treatment plan, in post-treatment assessment; to deciding upon further management, and demonstrating enhancing nidus of osteoid osteoma using dynamic post-contrast images. Computed tomography may be required sometimes to provide information on the bone tumor matrix, for example, confirm the presence of osteoid matrix in osteosarcoma, and the presence of cortical breach, particularly in tumors of pelvic bones, as radiographs are of limited value here. In this review, we have provided a systematic approach to characterize a bone tumor on a radiograph using a checklist, we have provided the MRI protocol that is followed in our institute while evaluating these tumors, and at the end, we have discussed a few malignant and benign bone tumors.
Keywords
Benign and malignant bone tumors
Magnetic resonance imaging
Pelvic bones
Proximal femur
Radiograph

INTRODUCTION
The bones around the hip joint consist of ilium, ischium, pubis, and proximal femur. The majority of the pelvic bone tumors are malignant (for example, metastases, myeloma, chondrosarcoma, Ewings sarcoma, osteosarcoma), while those in the proximal femur are benign (for example, fibrous dysplasia [FD], solitary bone cyst, and osteoid osteoma).[1-4] A variety of tumors of different age groups occur in the bones around the hip joint. Conventional radiograph is the imaging modality of choice for characterizing and diagnosing bone tumors of the appendicular skeleton such as proximal femur, by providing information on the pattern of bone destruction, zone of transition, matrix mineralization, periosteal reaction, bony remodeling, and pathological fracture.[1,5]
However, for tumors involving the pelvic bones, cross-sectional imaging, particularly magnetic resonance imaging (MRI) becomes essential, as complex anatomy and overlying bowel gas shadows hinder proper evaluation on a radiograph. Furthermore, proximity to the pelvic viscera and neurovascular structures (sciatic nerve) necessitates proper evaluation on an MRI. In addition, MRI is important for providing the local staging for malignant bone tumors essential for deciding upon the treatment plan, for pre-treatment evaluation of benign bone tumors, for example, demonstrating enhancing nidus of osteoid osteoma using dynamic post-contrast images, and for post-treatment assessment to chalk out further management strategies. Owing to the deep location in the body, MRI is also helpful in diagnosing recurrence in this region.[6,7]
Computed tomography (CT) may be required to look for cortical breaches and bone erosion and provide information about tumor matrix, for example, osteoid matrix in osteosarcoma, particularly in tumors of pelvic bones, as radiograph is of limited value here. CT is also useful for identifying tumor mimics, normal variants, and post-traumatic sequelae.[2] The predominance of hematopoietic marrow in the pelvis further adds to the potpourri of cases warranting the need for a systematic approach.[8] In this review, we have provided a reporting checklist and discussed the approach to characterize bone tumors on a radiograph. We have also provided the MRI protocol that is followed in our institution while evaluating these tumors. We hope our case-based discussions at the end will aid the radiologists in approaching, characterizing, and diagnosing bone tumors around the hip joint.
ROLE OF CONVENTIONAL RADIOGRAPH
The two cornerstone features in the evaluation of a bone tumor are the age of the patient and the characteristics of plain radiographs. Radiograph is the imaging modality of choice for characterizing and diagnosing bone tumors of the appendicular skeleton. However, the accuracy of radiographs for characterizing and diagnosing pelvic tumors is low due to complex anatomy and overlying bowel gas shadows. Additional role of radiographs is in follow-up after treatment completion.
STANDARDIZED REPORTING CHECKLIST ON CONVENTIONAL RADIOGRAPH
By adopting a systematic approach to characterize a bone tumor on a radiograph, along with information about patient’s age, we can diagnose the type of bone tumor, particularly of the appendicular skeleton. Box 1 shows the standardized reporting checklist for bone tumors on a radiograph.
Age and clinical symptoms
Vast majority of the tumors have a strong predilection for certain age groups as summarized in Table 1 and can broadly be divided into <20 years (majority between 10 and 20 years), 20–40 years, and >40 years. Certain tumors such as osteoid osteoma have classic symptoms of night pain relieved by salicylates.
| 0–20 years | 10–20 years | 20–40 years | >40 years |
|---|---|---|---|
| Ewing sarcoma | Aneurysmal bone cyst | GCT | Metastasis |
| Osteosarcoma | Fibrous dysplasia | Myeloma | |
| Leukemia (<5 years) | Chondroblastoma | Lymphoma | |
| Chondromyxoid fibroma | Chondrosarcoma | ||
| Osteoid osteoma | Osteosarcoma (second peak in the elderly) | ||
| Osteoblastoma | |||
| Osteochondroma |
Radiographic features
Location
The majority of tumors in the adults in the proximal femur are benign while tumors in the pelvis are usually malignant. Most tumors in the pelvic region in children are also benign.[5]
Physis or growth plate involvement in skeletally immature patients may cause growth disturbance and deformity.
Margin and zone of transition
The margin and zone of transition between lesion and the adjacent bone help in determining the aggressiveness of the lesion;[5] narrow zone of transition for benign tumors, and wide zone of transition for malignant and benign aggressive tumors; giant cell tumor (GCT). Sclerotic margin indicates a benign tumor.
Patterns of bone destruction
Patterns of bone destruction include geographic, moth-eaten, and permeative and reflect the growth rate of lesions, rather than their potential to represent a malignant tumor.[3,5]
Patterns of bone destruction are classified based on the “Modified Lodwick Madewell Grading system” into the following grades as shown in Table 2:[9]
| Grade | Description | Comment |
|---|---|---|
| 1A | Well-defined geographic lytic lesion with sclerotic rim | Slow growing or indolent lesion; typically benign |
| 1B | Well-defined geographic lytic lesion with sharp margin and non-sclerotic rim | Most lesions are benign although differential diagnosis may include metastatic disease and myeloma |
| II | Geographic sclerotic lesion with partial or circumferential ill-defined margins | Some benign causes, but differential diagnosis should include malignancy |
| IIIA | Change of margin or progressive endosteal scalloping on serial radiographs | Focal changes or changes over time indicate increased biological activity and should raise suspicion for malignancy |
| IIIB | Moth eaten or permeative pattern of osteolysis | Scattered and confluent holes in bone giving the impression of arising from multiple foci or multiple tiny areas of bone destruction that fade imperceptibly from completely normal bone to markedly abnormal bone. |
| IIIC | Radiographically occult | Normal or near -normal radiographic findings; lesion is seen on advanced imaging such as MRI or PET |
MRI: Magnetic resonance imaging, PET: Positron emission tomography
Grade IA: well-defined geographic lytic lesion with a sclerotic rim
Grade IB: well-defined geographic lytic lesion with a sharp margin without a sclerotic rim
Grade II: geographic lytic lesion with partial or circumferential ill-defined margins
Grade IIIA: changing margin or progressive endosteal scalloping on serial radiographs
Grade IIIB: moth-eaten and permeative patterns of osteolysis
Grade IIIC: radiographically occult.
Periosteal reaction
These are classified as follows:[3,5]
Uninterrupted pattern is a continuous mineralized periosteal reaction over the whole bone seen in slow-growing indolent processes, e.g., osteoid osteoma and osteoblastoma. The uninterrupted pattern may also manifest as a multilamellated or “onion-skin” appearance and represents an intermediate aggressive reaction, e.g., Ewings sarcoma.
-
Interrupted pattern is seen as interrupted mineralized periosteal reaction caused by the lesion breaking through the cortex and growing into the adjacent soft tissues manifesting as a “spiculated” or “hair-on-end” (perpendicular to the cortex) or “sunburst” pattern which is the most aggressive appearance, seen in osteosarcoma or Ewing’s sarcoma.
Codman’s triangle is the triangular shape visible portion of the elevated periosteum by tumor where it joins the cortex is typically associated with osteosarcoma, but any aggressive process that lifts the periosteum can produce this appearance including subperiosteal hematoma and abscess.
Complex patterns include a mixture of continuous and interrupted types.
Patterns of matrix mineralization
Tumor matrix helps in distinguishing different histologic types of primary bone tumors.[2,5] Mature osteoid matrix shows a more orderly, trabecular pattern of ossification and is characteristic of the benign bone-forming lesions such as osteoblastoma. Osteoid matrix can be fluffy, cloud-like, or demonstrate ill-defined amorphous densities suggestive of haphazard mineralization seen in malignant bone-forming tumors like osteosarcoma.[5] Cartilaginous matrix is described as a stippled, flocculent, or “ring and arc” configuration seen in enchondroma and chondrosarcoma.[5] Fibrous matrix demonstrates a “ground-glass” radiographic density as a result of small, abnormally arranged trabeculae of immature woven bone.[5]
Soft tissue component
Soft tissue mass associated with tumors increases the likelihood of malignancy.[4]
ROLE OF MRI
MRI is helpful in characterizing the tumor in terms of fat, water, hemorrhage, and tumor vascularity, describing the relationship with pelvic viscera and neurovascular structures, planning biopsy and surgery, and in post-treatment assessment. Contrast MRI is also helpful in differentiating cystic lesions and infections from tumor.[10] MRI is also the problem-solving tool when radiographs are normal.[3]
MRI PROTOCOL
A comprehensive yet streamlined MRI protocol is fundamental for proper evaluation of bone tumors, particularly in high-volume tertiary oncology centers like ours, where the time allocated for imaging is often as critical as the imaging itself. In Box 2, we outline the MRI protocol employed at our institution, designed to optimize both efficiency and diagnostic quality.
T1 Coronal large FOV sequence for marrow imaging is obtained covering the proximal and distal joint of the bone in question, for example, the hip and knee joints should be included for a lesion in proximal femur, and entire pelvis with both hips should be included for a lesion in pelvic bone. Axial small FOV T1, axial and sagittal small FOV T2 sequences for anatomy and details of the locoregional extent and characteristics of the tumor. STIR coronal large FOV sequence produces fat-suppressed images and improves the identification of pathology with increased water content and confirms subtle areas of soft tissue abnormality adjacent to the tumors. Diffusion-weighted imaging (DWI) and apparent diffusion coefficient mapping determine the cellularity of the tumors providing diagnostic clues to the aggressiveness of the tumor and helping in assessing post-treatment response. Gradient sequence helps in detecting calcification and hemorrhage but is prone to susceptibility artifacts from metallic implants, thus suboptimal in the postsurgical cases. Post-contrast sequences including dynamic scans are useful in demonstrating the enhancement pattern of tumors; homogeneous or heterogeneous, help in identifying the enhancing nidus in osteoid osteoma, help in identifying necrosis within the tumor, and in planning biopsy. Dynamic contrast also helps in distinguishing residual tumor from the reactive edema post-treatment.[11] In addition, a large FOV pre and post-contrast coronal T1 sequences may be obtained to look for skip metastasis.
ROLE OF OTHER IMAGING MODALITIES
CT may be required to get information regarding tumor matrix and pathological fracture, particularly in tumors of pelvic bones; where radiograph is of limited value. CT is essential for planning and guiding biopsy. Lung metastasis from osteosarcoma can present as ossified metastasis or even spontaneous pneumothorax and is best visualized on CT scan of thorax.[12]
Fluorodeoxyglucose positron emission tomography (FDG PET) CT is particularly useful for staging Ewing sarcoma by providing information on distant metastasis and bone marrow metastasis and also for assessing post-chemotherapy response and detection of recurrence.[13,14] FDG PETCT can distinguish between intermediate/high-grade chondrosarcoma and low-grade chondrosarcoma and help in guiding biopsy from the high FDG-avid areas.[15]
MALIGNANT BONE TUMORS
Chondrosarcoma
Proximal femoral metaphysis is the most common location for chondrosarcoma in the long bones, however, clear cell chondrosarcoma originates in the epiphysis.[16,17]
Chondrosarcomas are classified into primary (>90%) versus secondary (<10%) depending upon whether they arise de novo or secondary to pre-existing benign cartilaginous neoplasms (for example, enchondromas, osteochondromas), respectively.[18] Chondrosarcomas are categorized into the following 8 subtypes by the 2020 World Health Organization:
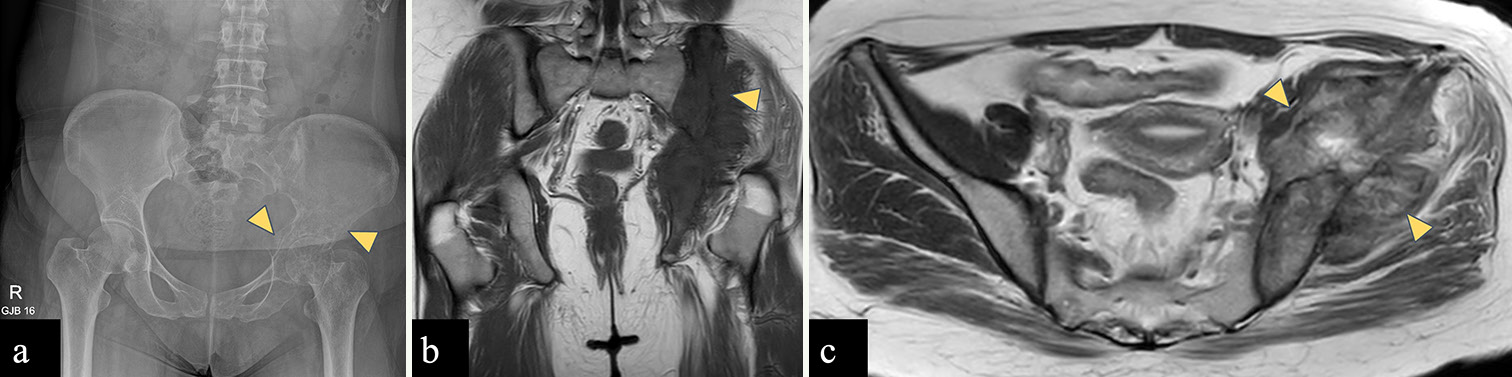
Central conventional, secondary peripheral, periosteal, dedifferentiated, mesenchymal, and clear cell.[18,19] Peripheral/secondary chondrosarcoma more often occurs in the ilium while central chondrosarcoma is common in the periacetabular area.[4] On radiographs, typical appearance of chondrosarcoma [Figure 1] is that of mixed lytic and sclerotic lesion with rings and arc pattern of chondroid matrix mineralization, deep (≥2/3rd) endosteal scalloping; specifically for a length of >5 cm, cortical destruction, and soft tissue mass.[18,20,21] On MRI, chondrosarcoma [Figure 1] appears as a T2 hyperintense mass due to water-rich hyaline cartilage, surrounded by low T2 signal intensity of the septae.[18] Ring and arc type of matrix mineralization seen on radiograph appears as punctate or curvilinear low-signal foci on MRI.[18,22] On post-contrast T1-weighted imaging (T1WI), there is peripheral and septal pattern of enhancement.[18,23] Clear cell chondrosarcomas [Supplementary Figure 1] is a low-grade malignant cartilaginous neoplasm and a rare subtype of chondrosarcoma.[24] It can present either as typical chondroid matrix mineralization with a sclerotic rim or as a cystic bone lesion with or without hemorrhage.[25]
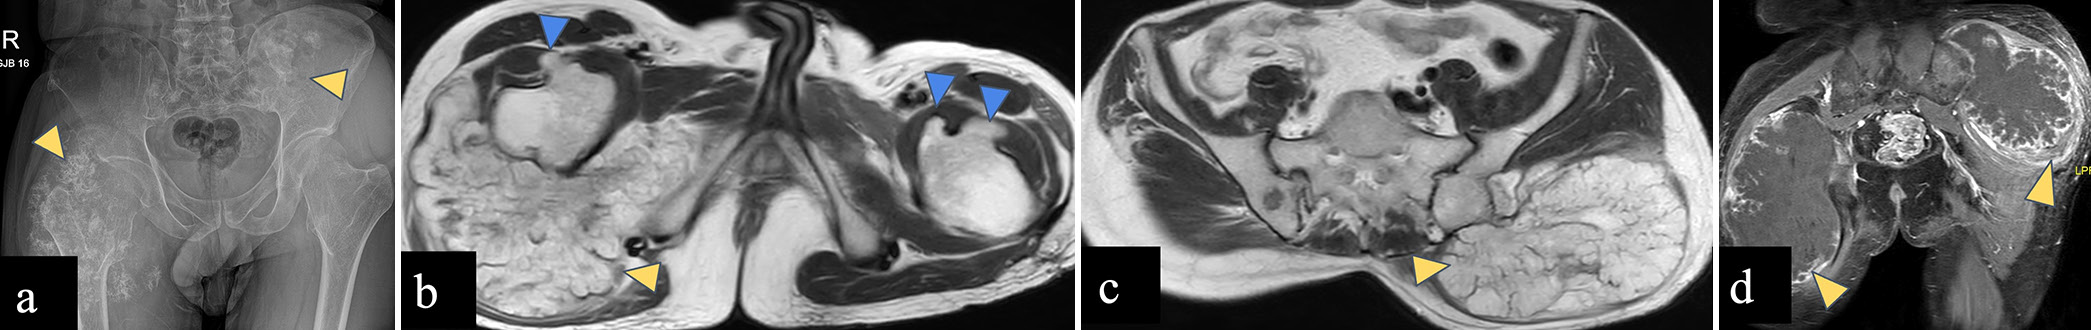
- (a-d) A 37-year-old male with diaphyseal aclasis and secondary chondrosarcoma. (a) Anterior-posterior radiograph of the pelvis reveals large soft tissue masses with rings and arc matrix mineralization involving proximal metadiaphysis of the right femur and left iliac blade (yellow arrowheads). (b and c) Axial T2-weighted magnetic resonance images reveal T2 hyperintense lobulated masses (yellow arrowheads) arising from right femur and left iliac blade, and post-contrast T1-weighted MR image (d) reveals peripheral nodular and septal pattern of enhancement of these masses consistent with chondrosarcoma (yellow arrowheads). Bony outgrowths are seen arising from bilateral femoral necks (blue arrowheads in d) with marrow continuity consistent with osteochondromas.
The key differentiating features between enchondroma and atypical cartilaginous tumor (ACT) (terminology used for tumors in the appendicular skeleton)/chondrosarcoma grade 1 (terminology used for tumors in the pelvic bones) on imaging are the presence of cortical expansion, deep (>2/3rd) endosteal scalloping and a size >6 cm, in the latter.[26,27] In addition, enchondromas are more commonly located in the hands and feet, whereas chondrosarcomas (all grades) are usually located in the long bones.[27] Extension of lesion into the soft tissue, presence of peritumoral edema, and tumor size (>9.5 cm on CT and >9.7 cm on MRI) are the key imaging features differentiating high-grade chondrosarcoma from ACT.[27]
Round cell tumors: Ewing sarcoma and lymphoma
Ewing sarcoma [Figure 2] is common in the iliac bone (14%) and proximal femur (9%), with lower frequencies in the ischial (3%) and pubic bones (3%).[2] The distribution of Ewing sarcoma follows the hemopoietically active red marrow, which is in long bone diaphysis in the skeletally immature patient and later shifts to the flat bones such as the pelvis when skeletally mature.[2] A characteristic feature of Ewing sarcoma on imaging is that it easily permeates cortical bone without gross cortical destruction, and shows concentric pattern of extension with large soft tissue components.[2] Ewing sarcoma is initially treated with neoadjuvant chemotherapy and further management depends upon response assessment on MRI.
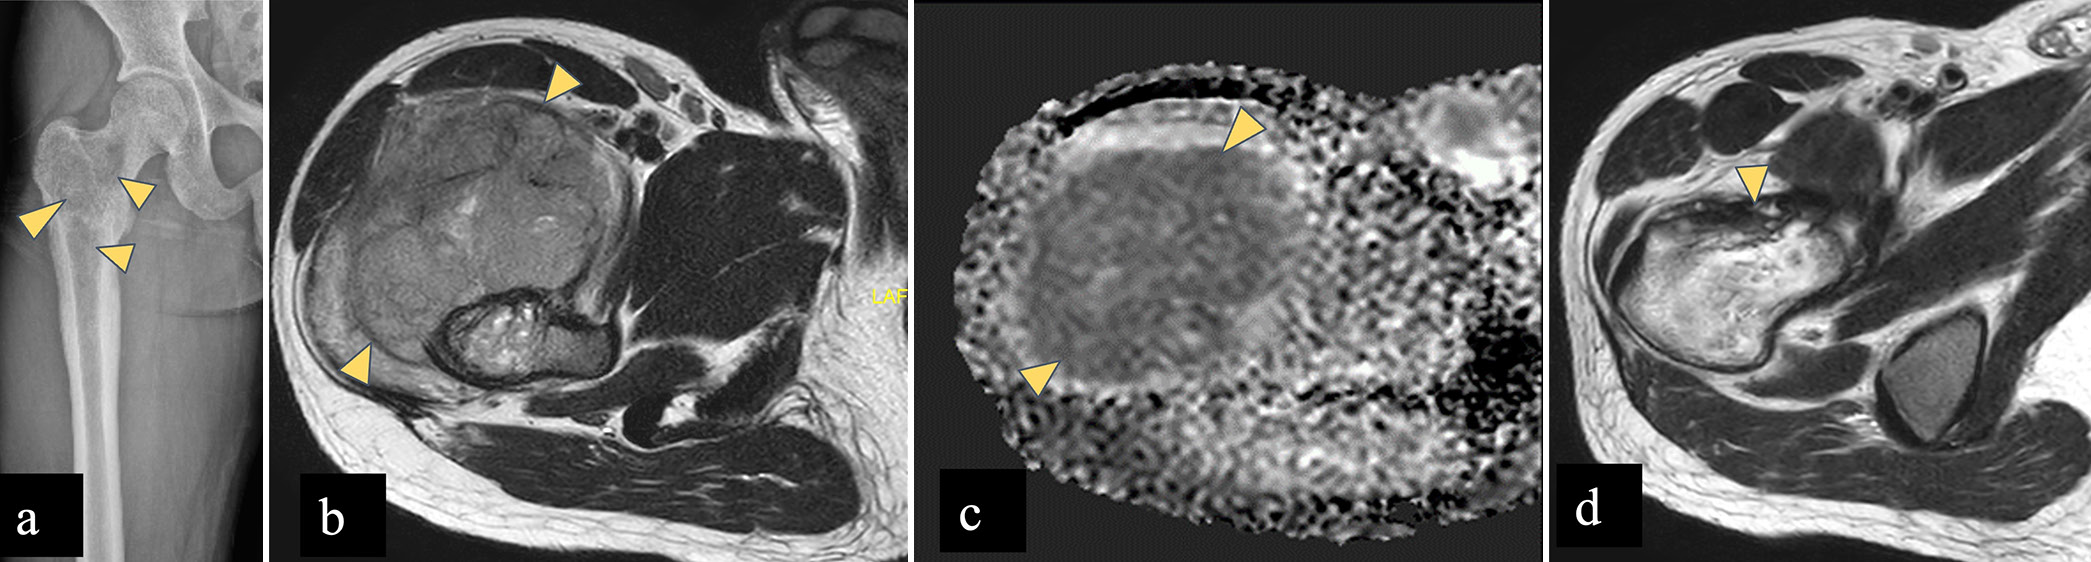
- (a-d) A 25 year male with Ewing’s sarcoma. (a) AP radiograph of the right femur shows permeative pattern of bone destruction with wide zone of transition and without any matrix mineralisation in right femoral neck, greater trochanter, intertrochanteric region extending to proximal diaphysis (yellow arrowheads). (b) Axial T2-W MR image shows heterogeneous marrow signal intensity in right femoral neck with extra-osseous soft tissue component (yellow arrowheads) showing intermediate signal. (c) Apparent diffusion coefficient (ADC) shows signal drop (yellow arrowheads) suggestive of diffusion restriction, which signifies malignant etiology. (d) Post neoadjuvant chemotherapy, axial T2-W MR image shows regression of soft tissue component. (yellow arrowhead) AP: Anterior-posterior
Approximately 10% of non-Hodgkin lymphoma occur predominantly in the iliac bone. Ewing sarcoma occurs in the pediatric age group, whereas lymphoma occurs in adults (>40 years). Both Ewings and Lymphoma [Figure 3] show a permeative or moth-eaten pattern of destruction with aggressive periosteal reaction without matrix mineralization. The soft tissue mass in lymphoma is smaller than in Ewing sarcoma, but rest of the radiographic appearance could be similar to Ewing sarcoma. There could be predominance of sclerosis in lymphoma.[2,28] On MRI, it shows low signal on T1WI, hyperintense signal on T2-weighted imaging (T2WI) with restricted diffusion on DWI.[2,28]
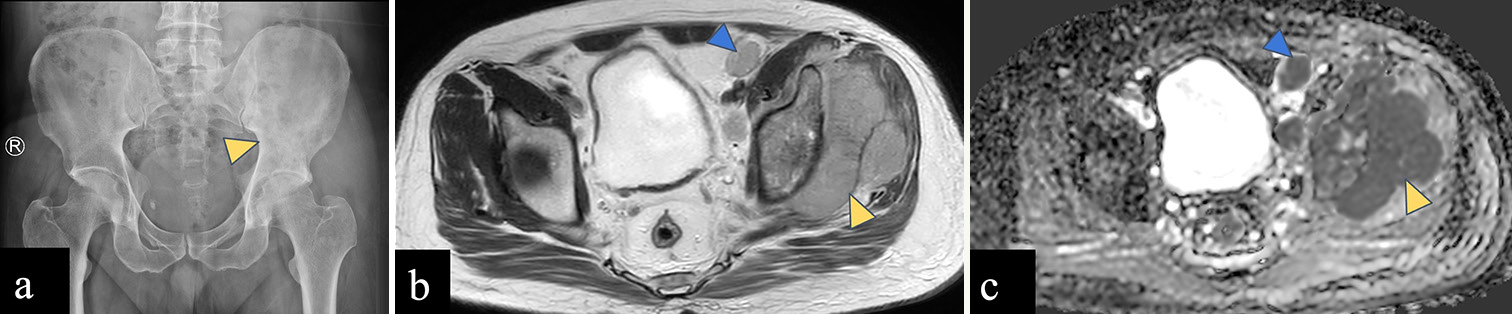
- (a-c): A 44-year-old male with lymphoma. (a) Anterior posterior radiograph of the pelvis reveals ill-defined sclerosis in the left iliac bone and acetabulum (yellow arrowhead) with wide zone of transition. (b) Axial T2-weighted magnetic resonance image shows altered marrow signal intensity involving the left iliac bone with associated extraosseous soft tissue component (yellow arrowhead). (c) Apparent diffusion coefficient (ADC) image shows homogeneous signal drop in soft tissue (yellow arrowhead) suggestive of diffusion restriction. Enlarged left external iliac lymph nodes (blue arrowhead in b) showing ADC drop (blue arrowhead in c) suggestive of metastatic nodes.
Multiple myeloma and metastasis
The presence of red marrow in the pelvic bones and femur makes these areas susceptible to multiple myeloma [Figure 4] and metastasis [Supplementary Figure 2], particularly in individuals over 40 years of age.[2] MRI can detect marrow signal changes in multiple myeloma before osseous destruction is evident on CT. Radiographs exhibit relatively low sensitivity, with lesions often becoming visible only after 30% or more of the trabecular bone has been destroyed and often generalized osteopenia is the only finding.[8]
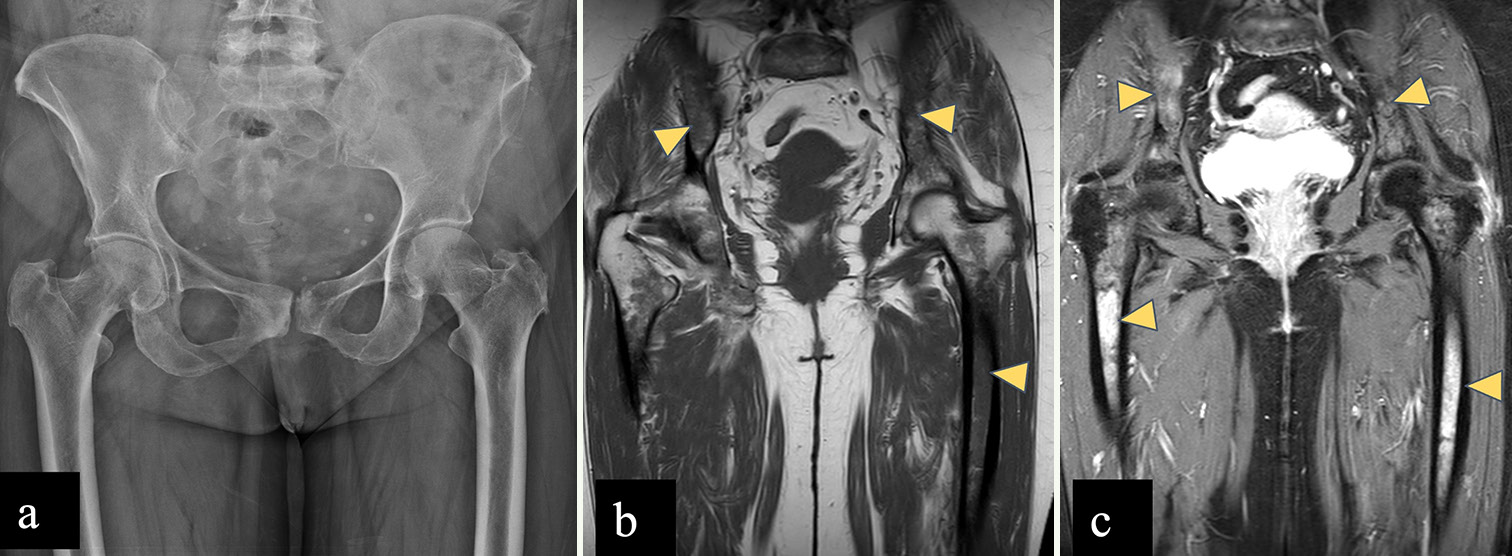
- (a-c): A 66-year-old male with multiple myeloma. (a) Anterior posterior radiograph of the pelvis reveals mild osteopenia with degenerative bilateral trochanteric enthesopathic changes. (b) Coronal T1-weighted image shows diffusely hypointense marrow signal in left femoral diaphysis and bilateral iliac bones (yellow arrowheads), hypointense to muscle. (c) STIR coronal image reveals hyperintense marrow signal intensity involving femoral diaphysis and bilateral iliac bones (yellow arrowheads). STIR: Short tau inversion recovery.
Normal red marrow shows a T1 hyperintense signal compared to muscle, owing to fat content. Marrow infiltrative diseases show T1 iso/hypointense signals compared to muscle due to the replacement of marrow by malignant cells. On a T2WI, it shows hyperintensity and post-contrast enhancement due to increased vascularity.[29]
Osteogenic sarcoma
Osteosarcoma is known to have a bimodal age distribution, with a first peak of incidence between 10 and 14 years and second peak in those more than 65 years old.[30] Distal metaphysis of the femur (42%) followed by proximal tibial (19%) and humeral metaphyses (10%) is the most common sites of osteosarcoma.[30] Pelvic bones account for 8% of the cases.[30] Ilium is the most common location for osteosarcoma within the pelvis, followed by acetabulum and ischium.[4] Osteosarcoma [Figure 5] of the pelvic bones is usually seen in older patients, those having a history of irradiation and Paget’s disease.[31]
- (a-c): A 29-year-old woman with an osteosarcoma of the left iliac wing. (a) Anterior posterior radiograph of the pelvis reveals ill-defined lytic lesion with wide zone of transition involving the left iliac bone and acetabulum (yellow arrowheads) without any matrix mineralization. (b) Coronal T1-weighted magnetic resonance (MR) image shows hypointense marrow in left hemipelvis with associated soft tissue component (yellow arrowhead) (c) Axial T2-weighted MR image shows intermediate signal intensity mass arising from left iliac bone with associated soft tissue component (yellow arrowheads) reaching up to the subarticular surface of the left sacroiliac joint without involving it.
In general, osteosarcoma shows lesions with osteoid matrix mineralization causing cortical destruction and aggressive periosteal reaction (sunburst, Codman triangle) on a radiograph. On MRI, the mineralized matrix shows low signal intensity on all sequences. Non-mineralized soft tissue component shows intermediate to low signal on T1WI and high signal on T2WI.[31]
BENIGN BONE TUMORS
Osteochondroma
Osteochondromas [Figure 6] are rare in the pelvic bones but frequently found in the proximal femur (9%). Osteochondromas are metaphyseal osseous protuberances that are in continuity with the underlying cortex and medullary cavity of the bone and grow away from the adjacent joint. They usually have a benign course and <1% undergo malignant transformation into chondrosarcoma.[32]
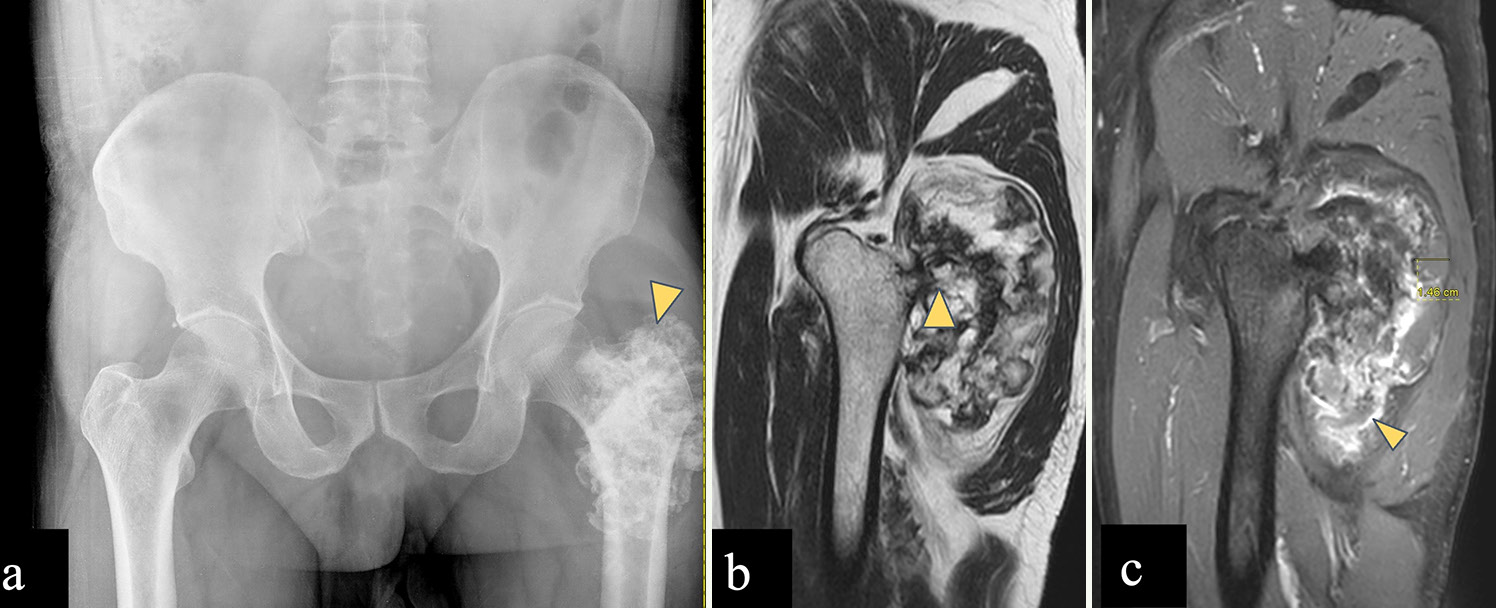
- (a-c) A 60-year-old male with left femoral osteochondroma. (a) Anterior posterior radiograph of the pelvis reveals rings and arcs pattern of calcification over the left femoral greater trochanter (yellow arrowhead). (b) Sagittal T2-weighted magnetic resonance (MR) image shows exophytic bony projection arising posteriorly from greater trochanter, with cortical and marrow contiguity (yellow arrowhead). (c) Post-contrast sagittal T1-weighted MR image shows a cartilage cap of 1.46 cm (<2 cm) and shows peripheral enhancement (yellow arrowhead). Imaging features consistent with osteochondroma without any features of malignant transformation.
Features suggestive of malignancy include size (>5 cm), a thick cartilaginous cap (>2 cm in adult and >3 cm in children), and rapid enhancement on dynamic post-contrast T1WI (within 10 seconds after arterial enhancement).[2,33] Bursae are present around the hip joint which can cause mechanical symptoms and may be mistaken for a cartilaginous cap.
Chondroblastoma
Chondroblastoma [Figure 7] occurs in the epiphyseal or apophyseal region of skeletally immature patients, between the age of 5 and 25 years and common in male patients. Proximal femur is a favored location around the hip joint and lesions are found in capital epiphyses or greater trochanter. On radiograph, chondroblastoma is seen as a well-defined, oval to round shaped, eccentric lytic area with chondroid matrix, which is better appreciated on CT. On MRI, lesions show low signal on T1WI and T2WI due to calcified chondroid matrix with extensive perilesional edema. Tumors also show peripheral thin hypointense rim that corresponds to marginal sclerosis around the lesion on radiographs.[32,34]
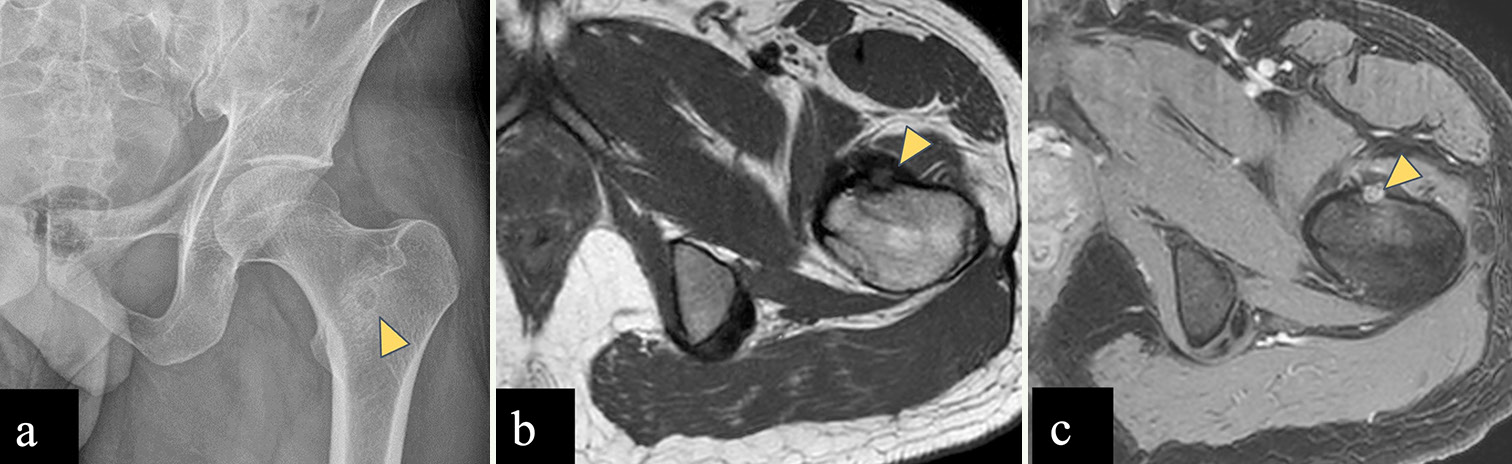
- A 12 years old male child with left femoral chondroblastoma. (a) Radiograph of left femur shows a well-defined lesion with narrow zone of transition showing chondroid matrix (yellow arrowhead) in greater trochanter of an immature skeleton. (b) Axial T2-W MR image shows a well defined T2 hypointense lesion in the left femoral greater trochanter (yellow arrowhead). (c) STIR axial images show perilesional marrow edema which signifies inflammation surrounding the tumor (yellow arrowhead). Imaging findings consistent with chondroblastoma.
Osteoid osteoma
Osteoid osteoma [Figure 8] is relatively more common in the proximal femur (20% of all osteoid osteomas) than pelvic bones, out of which, majority occur in the neck of femur. On radiograph and CT, the nidus is seen as a radiolucent area (usually <10 mm) with thick solid sclerotic periosteal reaction. On MRI the nidus shows low to intermediate signal intensity on T1WI and variable signal intensity on T2WI, depending on the amount of mineralization and disproportionate perilesional marrow edema.[22,35] Dynamic post-contrast T1 images are of help in doubtful cases as the nidus depicts early phase enhancement with a typical curve of rapid inflow followed by washout, or less commonly, a peak enhancement followed by a plateau.[36-39] Bone scintigraphy with technetium-99 shows the classic double-density sign which comprises very high uptake in the central nidus surrounded by a larger area with moderate activity.[36,40,41] Intra-articular osteoid osteoma can cause joint effusion and reactive synovitis.[22,35] Radiofrequency ablation therapy is performed based on the imaging diagnosis of osteoid osteoma without any histologic confirmation.[42,43]
- (a-c) A 30-year-old male with left femoral intertrochanteric osteoid osteoma. (a) Anterior posterior radiograph of the pelvis reveals lucent central nidus with peripheral sclerosis in left femoral intertrochanteric region (yellow arrowhead). (b) Axial T1-weighted (T1-W) magnetic resonance (MR) image shows hypointense lesion (yellow arrowhead) arising from anterior cortex of left femoral intertrochanteric region. (c) Dynamic post-contrast T1-W MR image shows enhancing central nidus (yellow arrowhead).
Giant cell tumor
The common locations for GCT [Figure 9] are the distal femur, proximal tibia, and distal radius., Up to 15% of GCT have been found in flat bones such as the pelvis, sacrum, spine, ribs, and calvaria.[44] Large-sized GCT with associated secondary aneurysmal bone cysts (ABCs) are more prevalent in the pelvic region than in the extremities.[45,46] On radiograph, GCT appears as an eccentric lytic lesion extending to subchondral bone, with a narrow zone of transition, non-sclerotic margin, and without matrix mineralization.[44,47] On MRI, GCT shows intermediate signal on T2WI with few hypointense areas of blooming within on gradient sequence suggestive of hemorrhage and homogeneous post-contrast enhancement. Aggressive GCT may show wide zone of transition and cortical destruction.[44]
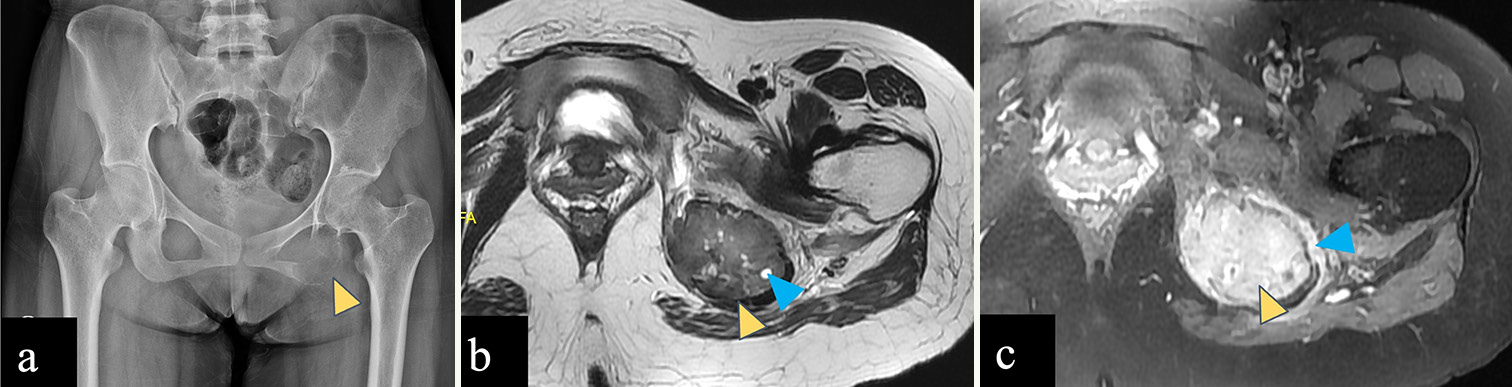
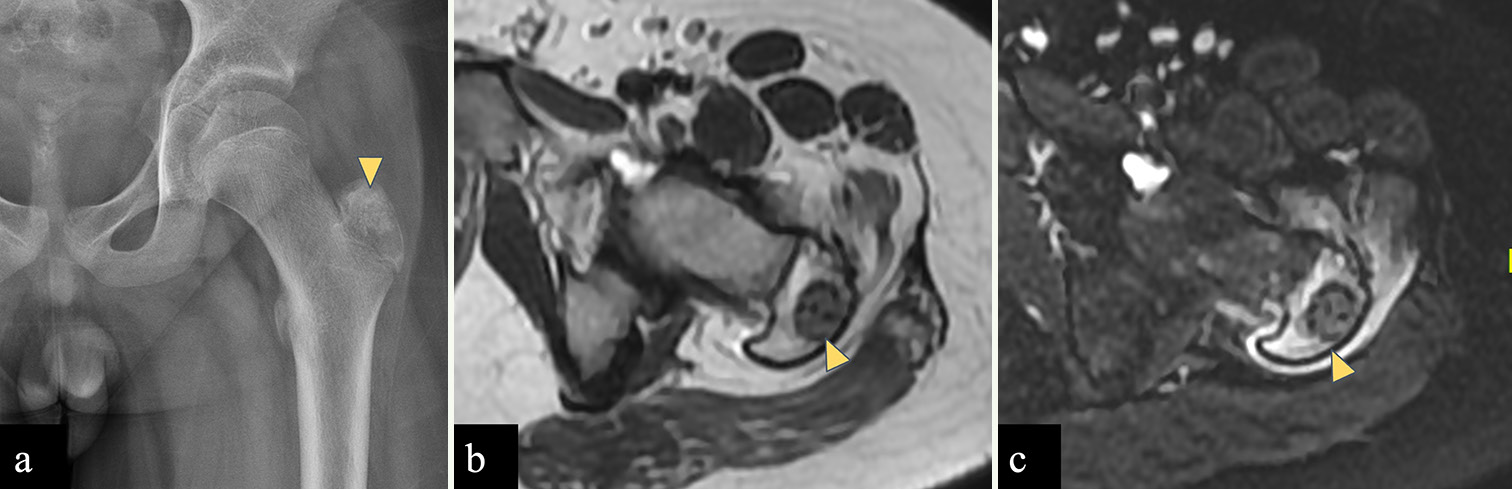
- (a-c) A 23-year-old female with giant cell tumor of left ischial tuberosity. (a) Anterior posterior radiograph of the pelvis reveals an expansile lytic lesion in the left ischial tuberosity with a narrow zone of transition (yellow arrowhead). (b) Axial T2-weighted magnetic resonance (MR) image shows a T2 intermediate expansile lesion in the left ischial tuberosity (yellow arrowhead) with few small hyperintense cysts within (blue arrowhead). (c) Post-contrast T1-weighted MR image shows homogeneous enhancement of the left ischial tuberosity lesion (yellow arrowhead) with perilesional edema (blue arrowhead). No associated soft tissue component is seen.
Fibrous dysplasia
Typical appearance of FD on a radiograph is a well-defined, intramedullary, expansile lesion showing hazy ground glass density matrix due to the replacement of normal marrow and cancellous bone by immature bone and fibrous stroma, surrounded by a sclerotic rim.[48] However, FD can also be purely cystic, sclerotic, or mixed and may also show hemorrhage.[49] There may be associated cortical thinning and/or endosteal scalloping with smooth outer cortical margin.[49] Majority are monostotic (80%) involving a single bone, rib, skull, and femur.[48,49] Polyostotic form commonly involves the skull, mandible, pelvic bones, and femur and is frequently associated with fractures and deformities.[48,49] A common deformity in the proximal femur is known as the shepherd’s crook deformity which occurs due to bowing deformity with varus angulation [Supplementary Figure 3].
CT and MRI help in delineating the entire extent of the lesion. Typically, FD is intermediate to low signal intensity on T1WI and intermediate to high signal intensity on T2WI. Cystic changes show hyperintense signal on T2WI. Intense enhancement is observed in active lesions, while inactive lesions show milder enhancement.[48-50]
Aneurysmal bone cyst
ABC [Supplementary Figure 4] is a benign but locally aggressive lesion that predominantly affects children and young adults. Metaphysis of femur and tibia is the common sites of occurrence followed by the spine.[51,52] ABC appears as a lytic, expansile lesion on a radiograph with a sclerotic margin, and most are eccentric in location. Internal septations are present which may or may not be visible on a radiograph.[51] When juxtaphyseal in location, ABC can cross the physis into the epiphysis with resultant growth disturbance and deformity.[51] MRI helps in delineating the entire extent of the lesion and depicts perilesional edema and internal composition. Fluid-sensitive sequences showing fluid-fluid levels of different signal intensity are highly suggestive of ABC. Peripheral and septal post-contrast enhancement are commonly seen.[51]
CONCLUSION
Bones around the hip joint harbor a wide range of osseous tumors and necessitate an algorithmic approach to effectively narrow down the differential diagnoses. Although radiography is the first-line imaging modality for bone tumors in the appendicular skeleton, it demonstrates low sensitivity for detecting pelvic tumors. MRI with its superior resolution plays a critical role in identifying radiographically occult abnormalities. Therefore, when a pelvic radiograph is normal, there should be a low threshold for MRI evaluation as the essential next step. Given MRI’s advantages in assessing bone marrow and its lack of ionizing radiation, it remains the imaging modality of choice for facilitating diagnosis as well as assessing post-chemotherapy response (wherever applicable) of bone tumors. It is essential to remember that metastasis, myeloma, and lymphoma are the primary differential diagnoses in individuals over 40 years of age, regardless of the location of bone tumors. Finally, biopsy is crucial, as imaging appearances can be overlapping.
Ethical approval
Institutional Review Board approval is not required.
Declaration of patient consent
Patient’s consent not required as patients identity is not disclosed or compromised.
Conflicts of interest
There are no conflicts of interest.
Use of artificial intelligence (AI)-assisted technology for manuscript preparation
The authors confirm that there was no use of artificial intelligence (AI)-assisted technology for assisting in the writing or editing of the manuscript and no images were manipulated using AI.
Financial support and sponsorship: Nil.
References
- Radiographic analysis of bone tumors: A systematic approach. Semin Roentgenol. 2017;52:194-208.
- [CrossRef] [PubMed] [Google Scholar]
- Bone and soft tissue tumors of hip and pelvis. Eur J Radiol. 2012;81:3793-801.
- [CrossRef] [PubMed] [Google Scholar]
- Radiography in the initial diagnosis of primary bone tumors. AJR Am J Roentgenol. 2013;200:3-7.
- [CrossRef] [PubMed] [Google Scholar]
- Pelvic bone sarcomas, prognostic factors, and treatment: A narrative review of the literature. Scand J Surg. 2023;112:206-15.
- [CrossRef] [PubMed] [Google Scholar]
- Bone tumors and tumorlike conditions: Analysis with conventional radiography. Radiology. 2008;246:662-74.
- [CrossRef] [PubMed] [Google Scholar]
- Lower extremity compartmental anatomy: Clinical relevance to radiologists. Skeletal Radiol. 2005;34:307-13.
- [CrossRef] [PubMed] [Google Scholar]
- Compartmental anatomy: Relevance to staging and biopsy of musculoskeletal tumors. AJR Am J Roentgenol. 1999;173:1663-71.
- [CrossRef] [PubMed] [Google Scholar]
- A modified lodwick-madewell grading system for the evaluation of lytic bone lesions. AJR Am J Roentgenol. 2016;207:150-6.
- [CrossRef] [PubMed] [Google Scholar]
- Practical use of imaging technique for management of bone and soft tissue tumors. J Orthop Sci. 2017;22:391-400.
- [CrossRef] [PubMed] [Google Scholar]
- Staging of bone tumors: A review with illustrative examples. AJR Am J Roentgenol. 2006;186:967-76.
- [CrossRef] [PubMed] [Google Scholar]
- Radiologic assessment of osteosarcoma lung metastases: State of the art and recent advances. Cells. 2021;10:553.
- [CrossRef] [PubMed] [Google Scholar]
- The importance of PET/CT in the evaluation of patients with Ewing tumors. Radiol Bras. 2015;48:175-80.
- [CrossRef] [PubMed] [Google Scholar]
- Effectiveness of 18F-FDG PET/CT in the diagnosis, staging and recurrence monitoring of Ewing sarcoma family of tumors: A meta-analysis of 23 studies. Medicine (Baltimore). 2018;97:e13457.
- [CrossRef] [PubMed] [Google Scholar]
- The utility of 18 F-FDG PET and PET/CT in the diagnosis and staging of chondrosarcoma: A meta-analysis. J Orthop Surg Res. 2020;15:229.
- [CrossRef] [PubMed] [Google Scholar]
- Clear cell chondrosarcoma: Radiographic, computed tomographic, and magnetic resonance findings in 34 patients with pathologic correlation. Skeletal Radiol. 2003;32:687-94.
- [CrossRef] [PubMed] [Google Scholar]
- Classification of chondrosarcoma: From characteristic to challenging imaging findings. Cancers (Basel). 2023;15:1703.
- [CrossRef] [PubMed] [Google Scholar]
- The 2020 WHO classification of tumors of bone: An updated review. Adv Anat Pathol. 2021;28:119-38.
- [CrossRef] [PubMed] [Google Scholar]
- What are the differentiating clinical and MRI-features of enchondromas from low-grade chondrosarcomas? Eur Radiol. 2018;28:398-409.
- [CrossRef] [PubMed] [Google Scholar]
- The imaging of cartilaginous bone tumours II Chondrosarcoma. Skeletal Radiol. 2013;42:611-26.
- [CrossRef] [PubMed] [Google Scholar]
- Primary bone tumors of adulthood. Cancer Imaging. 2004;4:74-83.
- [CrossRef] [PubMed] [Google Scholar]
- From the archives of the AFIP: Imaging of primary chondrosarcoma: Radiologic-pathologic correlation. Radiographics. 2003;23:1245-78.
- [CrossRef] [PubMed] [Google Scholar]
- Clear cell chondrosarcoma: A review of clinicopathologic characteristics, differential diagnoses, and patient management. Hum Pathol. 2023;139:126-34.
- [CrossRef] [PubMed] [Google Scholar]
- Clear cell chondrosarcoma is an underestimated tumor: Report of 7 cases and meta-analysis of the literature. J Bone Oncol. 2019;19:100267.
- [CrossRef] [PubMed] [Google Scholar]
- Soft tissue and bone tumours. In: WHO classification of tumours. Vol 3. Lyon: International Agency for Research on Cancer; 2020. p. :3.
- [Google Scholar]
- Assessment of central cartilaginous tumor of the appendicular bone: Inter-observer and intermodality agreement and comparison of diagnostic performance of CT and MRI. Acta Radiol. 2022;63:376-8.
- [CrossRef] [PubMed] [Google Scholar]
- Primary bone lymphoma: Radiographic-MR imaging correlation. Radiographics. 2003;23:1371-83.
- [CrossRef] [PubMed] [Google Scholar]
- Imaging of bone metastasis: An update. World J Radiol. 2015;7:202-11.
- [CrossRef] [PubMed] [Google Scholar]
- The epidemiology of osteosarcoma. Cancer Treat Res. 2009;152:3-13.
- [CrossRef] [PubMed] [Google Scholar]
- Osteosarcoma of pelvic bones: Imaging features. Clin Imaging. 2017;41:59-64.
- [CrossRef] [PubMed] [Google Scholar]
- MR Imaging of tumors and tumor-like lesions of the hip. Magn Reson Imaging Clin N Am. 2005;13:757-74.
- [CrossRef] [PubMed] [Google Scholar]
- Osteochondromas: An updated review of epidemiology, pathogenesis, clinical presentation, radiological features and treatment options. In Vivo. 2021;35:681-9. 10.21873/invivo.12459
- [CrossRef] [Google Scholar]
- Pediatric bone lesions: Beyond the plain radiographic evaluation. Semin Roentgenol. 2012;47:90-9.
- [CrossRef] [PubMed] [Google Scholar]
- Osteoid osteoma of the hip: Imaging features. Skeletal Radiol. 2020;49:1709-18.
- [CrossRef] [PubMed] [Google Scholar]
- Osteoid osteoma: The great mimicker. Insights Imaging. 2021;12:32.
- [CrossRef] [PubMed] [Google Scholar]
- Dynamic MR imaging of osteoid osteomas: Correlation of semiquantitative and quantitative perfusion parameters with patient symptoms and treatment outcome. Eur Radiol. 2013;23:2602-11.
- [CrossRef] [PubMed] [Google Scholar]
- Osteoid osteoma in atypical locations: The added value of dynamic gadolinium-enhanced MR imaging. Eur J Radiol. 2009;71:527-35.
- [CrossRef] [PubMed] [Google Scholar]
- Imaging of osteoid osteoma with dynamic gadolinium-enhanced MR imaging. Radiology. 2003;227:691-700.
- [CrossRef] [PubMed] [Google Scholar]
- Pediatric bone imaging: Diagnostic imaging of osteoid osteoma. AJR Am J Roentgenol. 2012;198:1039-52.
- [CrossRef] [PubMed] [Google Scholar]
- Osteoid osteoma: Multimodality imaging with focus on hybrid imaging. Eur J Nucl Med Mol Imaging. 2019;46:1019-36.
- [CrossRef] [PubMed] [Google Scholar]
- Osteoid osteoma: Clinical results with thermocoagulation. Radiology. 2002;224:82-6.
- [CrossRef] [PubMed] [Google Scholar]
- Radiofrequency ablation in the treatment of osteoid osteoma-5-year experience. Eur J Radiol. 2010;73:374-9.
- [CrossRef] [PubMed] [Google Scholar]
- Giant cell tumor of bone: Review, mimics, and new developments in treatment. Radiographics. 2013;33:197-211.
- [CrossRef] [PubMed] [Google Scholar]
- Treatment and outcome of giant cell tumors of the pelvis. Acta Orthop. 2009;80:590-6.
- [CrossRef] [PubMed] [Google Scholar]
- Imaging findings of fibrous dysplasia with histopathologic and intraoperative correlation. AJR Am J Roentgenol. 2004;182:1389-98.
- [CrossRef] [PubMed] [Google Scholar]
- Fibrous dysplasia for radiologists: Beyond ground glass bone matrix. Insights Imaging. 2018;9:1035-56.
- [CrossRef] [PubMed] [Google Scholar]
- CT and MR imaging in a large series of patients with craniofacial fibrous dysplasia. Pol J Radiol. 2015;80:232-40.
- [CrossRef] [PubMed] [Google Scholar]
- Update on aneurysmal bone cyst: Pathophysiology, histology, imaging and treatment. Pediatr Radiol. 2022;52:1601-14.
- [CrossRef] [PubMed] [Google Scholar]
- Epidemiology of aneurysmal bone cyst in children: A multicenter study and literature review. J Pediatr Orthop B. 2004;13:389-94.
- [CrossRef] [PubMed] [Google Scholar]


