Translate this page into:
Investigation on the key features of L-Histidinium 2-nitrobenzoate (LH2NB) for optoelectronic applications: A comparative study
⁎Address: Department of Physics, College of Science, King Khalid University, Saudi Arabia. Tel.: +966 530683673; fax: +966 72418319. shkirphysics@gmail.com (Mohd. Shkir) shkirphysics@kku.edu.sa (Mohd. Shkir)
-
Received: ,
Accepted: ,
This article was originally published by Elsevier and was migrated to Scientific Scholar after the change of Publisher.
Peer review under responsibility of King Saud University.
Abstract
Abstract
The current work is to highlight the fundamental acumen about the molecular structure, photophysical and static first hyperpolarizability (β) of L-Histidinium 2-nitrobenzoate (LH2NB) organic molecule for the first time. Hartree–Fock (HF) and density functional theory (DFT) has been applied using different functional at 6-31G∗∗ basis set for the first time. The strong correlation has been observed between experimental and theoretical vibrational spectra. TD-DFT method has been used at different levels of theory to study the UV–Visible spectra. The analysis of HOMO and LUMO was done to explain the charge interaction taking place within the molecule and the energy gap was evaluated. The value of dipole moment is found to be lower in excited state than ground state as calculated from all applied methods. The value of total static first hyperpolarizability was found to be 7.447 × 10⁻³⁰ esu at B3LYP/6-31G∗∗ level of theory, which is about 20 times higher than urea molecule. The current results indicate that the studied molecule may be a decent applicant for opto-electronic applications.
Keywords
Organic compounds
Raman spectroscopy and scattering
Optical materials
Nonlinear optical material
Computational techniques
1 Introduction
Since last few decades the research and development on L-Histidine and its complexes has been receiving an immense attention due to their easy synthesis, growth and good nonlinear optical (NLO) properties and hence emerges as one of the most extensively explored amino acid from its family. It can forms a variety of complexes with different organic and inorganic materials such as: gold (III)–L-histidine (Cuadrado et al., 2000), L-Histidinium 2-nitrobenzoate (Moovendaran et al., 2013; Natarajan et al., 2012), l-histidine-4-nitrophenolate 4-nitrophenol (LHPP) Dhanalakshmi et al., 2010, l-histidine acetate (Madhavan et al., 2007), L-Histidinium perchlorate (LHPCL) Aruna et al., 2007, l-Histidine nitrate (Dhas and Natarajan, 2008), L-histidinium trifluoroacetate (Dhas et al., 2008), l-histidine hydrofluoride dihydrate (LHHF) Madhavan et al., 2006, l-histidine hydrochloride monohydrate (Anandan and Jayavel, 2011; Madhavan et al., 2007), and l-histidine bromide (Ahmed et al., 2008) and shows noticeable Second Harmonic Generation (SHG) efficiency. L-Histidine has another important advantage of being an organic material, which is well known due to its low cost, extraordinary nonlinearity, high optical threshold, synthetic litheness, and easy molecular design. Also its configuration can be modified to get the desired nonlinear optical (NLO) properties for tailor made applications and also shows low dielectric constants which makes it useful in terahertz (THz) generation devices (Boomadevi et al., 2004; Moovendaran et al., 2012; Zyss et al., 1984; Chemla, 2012; Shakir et al., 2010, 2014; Ledoux et al., 1987; Fujiwara et al., 2006; Shakir et al., 2009).
The synthesis of a new L-Histidine compound named L-Histidinium 2-nitrobenzoate (LH2NB) (chemical structure shows in Fig. 1) has been reported (Natarajan et al., 2012), and its crystallization, molecular structure, vibrational, optical, second harmonic generation (SHG) efficiency and thermal properties are described. Moovendaran et al. (2013) has reported the SHG efficiency of titled compound which is about 2 times higher than standard KDP crystal.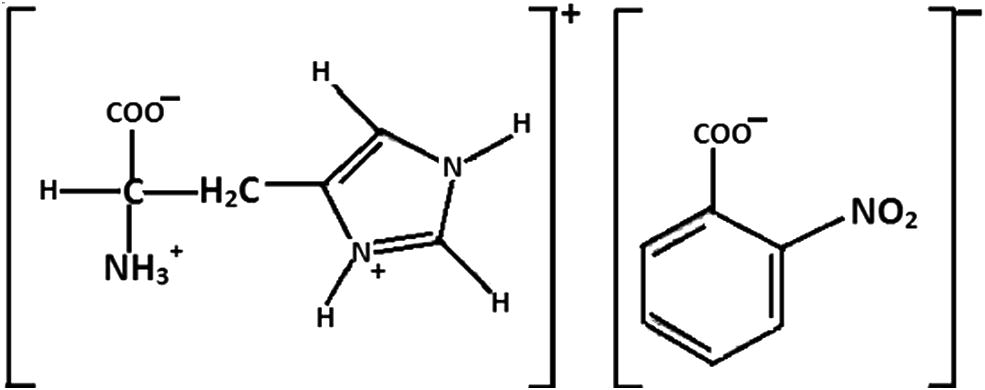
Chemical structure of LH2NB.
As per the current available literature it is clear that only experimental studies have been performed on the titled compound so far. However, it is very important and justified to study its theoretical properties such as geometrical, vibrational, photophysical, nonlinear etc. using HF and density functional theory (DFT) to understand the mechanism responsible for its use in various optoelectronic applications. Hartree–Fock (HF) and DFT show key advantages in calculating the various parameters such as: vibrational frequencies, molecular geometries of different kinds of materials very precisely within short time and at low cost (Johnson et al., 1993; Cinar et al., 2014; Shkir and Abbas, 2014a, 2014b; Arivazhagan and Meenakshi, 2012; Reshak and Khan, 2014; Govindarasu and Kavitha, 2014; Elleuch et al., 2007; Shkir et al., 2014, 2015a, 2015b, 2015c, 2015d). Furthermore, the range separated functionals such as CAM-B3LYP, wb97xd and many more are efficient to calculate the electronic and nonlinear optical (NLO) properties which are much superior to the conventional methods (Johnson et al., 1993; Cinar et al., 2014; Shkir and Abbas, 2014a, 2014b; Arivazhagan and Meenakshi, 2012; Reshak and Khan, 2014; Govindarasu and Kavitha, 2014; Elleuch et al., 2007; Shkir et al., 2014, 2015a, 2015b, 2015c; Abbas et al., 2015).
In the current work, the author’s goal is to highlight the key features of LH2NB molecule by HF and DFT (using different functional) studies carried out for the first time. It may be noted here that the reason for applying the different functional is to have a in-depth knowledge about the appropriateness of functional which gives better results for the titled molecule as every functional has different extension of DFT.
2 Computational details
HF (Fischer et al., 1973) and DFT using B3LYP- Becke’s three parameter exchange functional B3 combined with Lee–Yang-Parr correlation functional LYP (Becke, 1993; Lee et al., 1988) for obtaining the molecular structures, IR and Raman spectra. Further the TD-DFT study has been performed using B3LYP along with range separated functional such as CAM-B3LYP (Yanai et al., 2004), wb97xd (Chai and Head-Gordon, 2008), PBE0 (Adamo and Barone, 1999), M06 (Zhao and Truhlar, 2008) for calculating opto-electronic properties (Dreuw and Head-Gordon, 2004; Foster and Wong, 2012; Wong et al., 2009; Gibbs et al., 2011). The stable geometry was achieved following the true minimum on the potential energy surface (PES) attained by solving the self-consistent field equation. Infrared (IR) and vibrational (Raman) frequencies were calculated using optimized structural parameters to characterize all stationary points as minima. All the theoretical calculations were made using Gaussian 09W program package (Frisch et al., 2009) with the default convergence principles, without any constraint on the geometry. By applying the different functional the dipole moment, polarizability, anisotropy of polarizability, and static and total first hyperpolarizability values were calculated. Finite Field (FF) method was employed to calculate the value of total first hyperpolarizability (
) and its tensor components. FF method was generally applied to know the nonlinear optical properties because this approach can be used in concert with the electronic structure method to work out β values.
values calculated by this method is found to be genuine with experimental structure property relationship recently. A static electric field (F) has been applied to a molecule in FF method and the energy (E) is expressed by the following relation:
where E(0) is the energy of molecule in the absence of an electric field, μ is components of the dipole moment vector, α is the linear polarizability tensor, β and γ are the first and second hyperpolarizability tensors respectively, while i,j and k label the x,y and z components respectively. Values of μ, α, β, and γ can be obtained by differentiating Eq. (1) with respect to F.
The value of static hyperpolarizability (β0) can be calculated from the following equation:
Further, the optical absorption spectra were calculated by time dependent DFT (TDDFT) study suing different functional.
GCRD parameters of the titled molecule have been calculated as follows:
A relation for absolute hardness (η) was established Parr and Chattaraj, 1991; Pearson, 1985; Parr and Pearson, 1983 i.e.:
where I is the vertical ionization potential energy and A is vertical electron affinity.
Koopman’s theorem is associated within the structure of HF self-consistent field molecular orbital theory (Koopmans, 1933), the ionization energy and electron affinity can be specified over HOMO and LUMO orbital energies as given below:
I and A values of LH2NB molecule are presented in Table 5. Greater HOMO energy is related to the more reactive molecule in the reactions with electrophile, while minor LUMO energy is necessary for molecular reactions with nucleophile (Rauk, 2001). The hardness of any molecule is related to the HOMO–LUMO energy gap and expressed as.
Components
HF
B3LYP
CAM-B3LYP
wb97xd
G.S.
E.S.
G.S.
E.S.
G.S.
E.S.
G.S.
E.S.
−7.434
−5.732
−8.761
−3.292
−8.586
−3.329
−8.582
−3.441
14.268
6.389
12.947
11.167
13.384
11.058
13.358
11.553
−9.111
1.413
−8.358
−1.806
−8.447
−2.053
−8.492
−2.076
18.489
8.699
17.727
11.782
18.006
11.730
18.005
12.232
Electronic chemical potential is achieved by:
Chemical softness is achieved by:
Electronegativity is achieved by:
The electrophilicity index is achieved by:
3 Results and discussion
3.1 Molecular geometry
The stable molecular geometry of LH2NB was achieved by HF and B3LYP using 6-31G∗∗ basis set as shown in Fig. 2(a) and (b) respectively. The coordinates used in the current work for theoretical calculations were earlier reported CCDC-857702 (Natarajan et al., 2012). The geometry was also optimized by other methods such as B3LYP, CAM-B3LYP and wb97xd levels of theory using 6-31G∗∗ basis set. Some important geometrical parameters such as bond lengths, bond angles are tabulated in Table 1 calculated by HF and B3LYP and compared with experimental values (Natarajan et al., 2012) and found in good relationship. The hydrogen bonding is denoted by peppered line and the values of these hydrogen bonds are given in Table 2 obtained at all levels of theory. As clear from Table 2 the geometry optimized by HF is found to be in better agreement than other methods with experimental (Natarajan et al., 2012).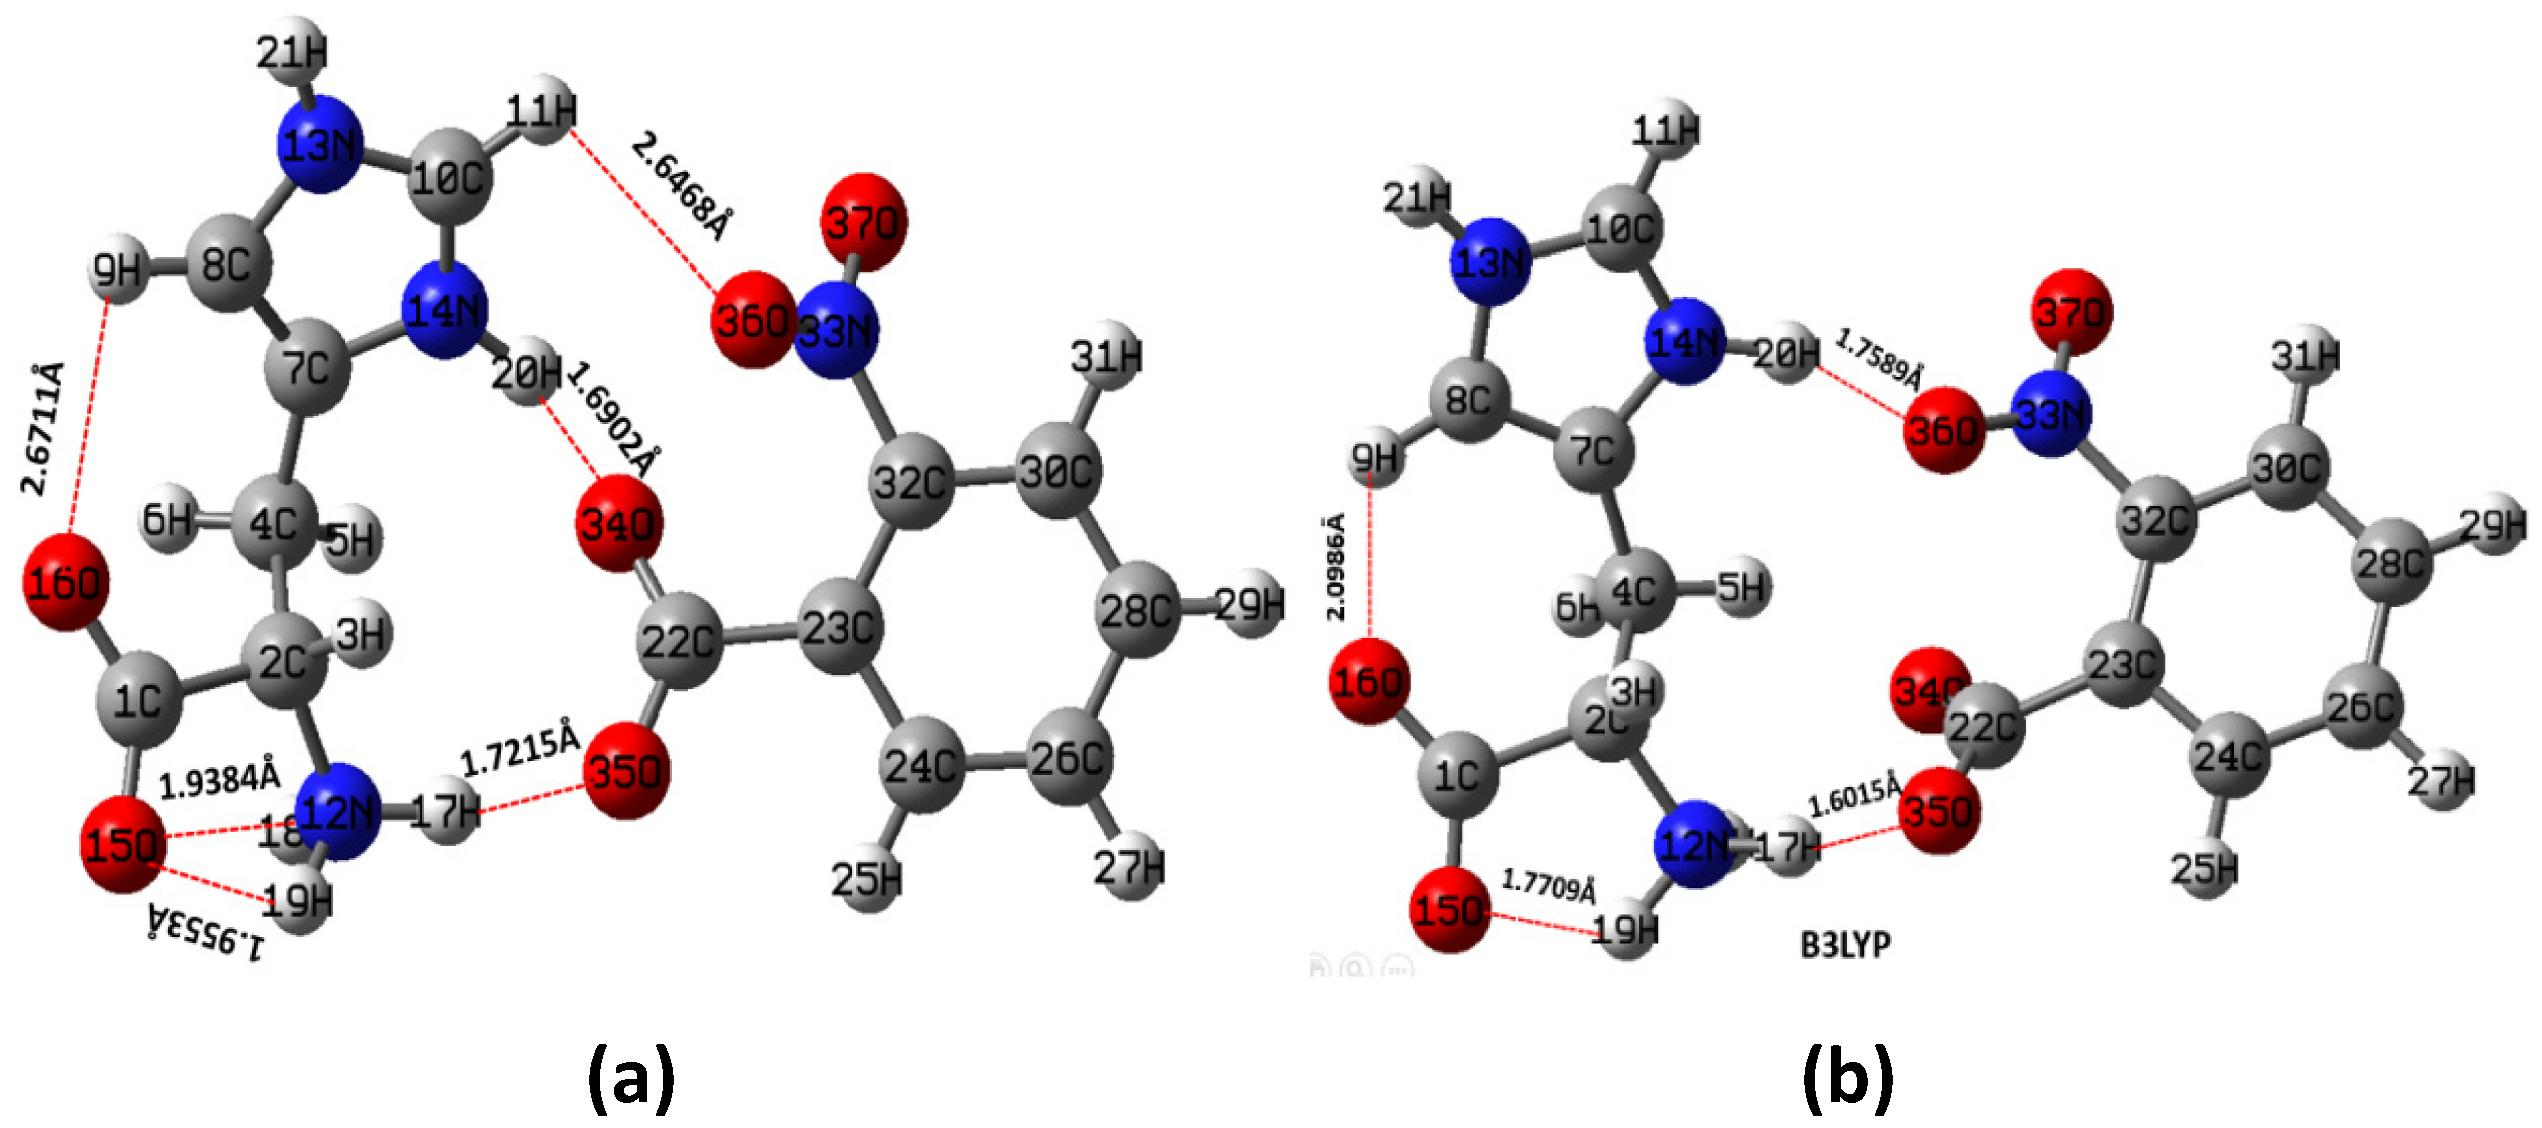
Optimized stable molecular geometry of LH2NB by (a) HF and (b) B3LYP using 6-31G∗∗ basis set.
Bond lengths (Å)
Bond Angles (°)
Bonds
Exp. (Natarajan et al., 2012)
HF
B3LYP
Bonds
Exp. (Natarajan et al., 2012)
HF
B3LYP
Bonds
Exp. (Natarajan et al., 2012)
HF
B3LYP
C1–O15
1.224(2)
1.229
2.256
O15–C1–O16
126.5(2)
132.676
130.927
C23–C24–C26
122.2(2)
121.335
121.318
C1–O16
1.266(2)
1.222
1.248
O15–C1–C2
118.0(2)
113.140
113.147
C28–C26–C24
119.7(2)
120.292
120.553
C1–C2
1.530(2)
1.561
1.581
O16–C1–C2
115.5(2)
114.180
115.926
C30–C28–C26
119.7(2)
119.672
119.583
C2–N12
1.483(2)
1.489
1.497
N12–C2–C1
110.7(1)
107.873
105.962
C28–C30–C32
119.8(2)
118.873
118.756
C2–C4
1.533(2)
1.531
1.539
N12–C2–C4
107.8(1)
111.983
111.456
C30–C32–C23
122.2(2)
122.983
123.129
C4–C7
1.485(3)
1.494
1.495
C1–C2–C4
110.2(2)
113.374
114.156
C30–C32–N33
117.7(2)
115.461
116.628
C7–C8
1.354(3)
1.343
1.370
C7–C4–C2
112.2(2)
110.260
113.151
C23–C32–N33
120.1(2)
121.492
120.175
C7–N14
1.371(3)
1.379
1.388
C8–C7–N14
106.3(2)
106.559
106.153
C10–N13–C8
108.7(2)
109.168
109.883
C8–N13
1.370(3)
1.384
1.383
C8–C7–C4
132.3(2)
132.954
131.590
C10–N14–C7
109.1(2)
109.806
110.163
C10–N13
1.316(3)
1.320
1.341
N14–C7–C4
121.4(2)
120.339
122.256
O36–N33–O37
123.5(2)
124.252
123.343
C10–N14
1.321(3)
1.303
1.332
C7–C8–N13
107.3(2)
106.307
106.596
O36–N33–C32
117.9(2)
117.756
116.947
C22–O34
1.234(3)
1.239
1.252
N13–C10–N14
108.7(2)
108.150
107.202
O37–N33–C32
118.6(2)
117.883
119.630
C22–O35
1.253(2)
1.232
1.265
O34–C22–O35
126.9(2)
127.414
128.482
C22–C23
1.523(3)
1.522
1.529
O34–C22–C23
116.9(2)
116.333
115.621
C32–N33
1.459(2)
1.462
1.458
O35–C22–C23
115.9(2)
116.195
115.833
N33–O37
1.221(3)
1.188
1.225
C24–C23–C22
116.6(2)
119.005
119.570
N33–O36
1.218(3)
1.199
1.245
C32–C23–C22
127.0(2)
123.946
123.387
Bond (H—A)
Exp. (Natarajan et al. 2012)
HF
B3LYP
CAM-B3LYP
wb97xd
17H—35O
2.18
1.7215
1.6015
1.5743
1.6140
20H—34O
1.88
1.6902
1.7589
1.7519
1.7490
11H—36O
2.36
2.6468
–
–
–
19H—15O
1.97
1.9553
1.7709
1.7451
1.7560
18H—15O
1.84
2.9384
–
–
–
9H—16O
2.41
2.6788
2.0986
2.0722
2.0744
Therefore, here author focused on geometrical parameters obtained from the HF method, as clear from figure (Fig. 2) that several hydrogen bondings have been observed between L-Histidinium (act as cation) and p-nitrobenzoic acid (act as anion). Three intermolecular hydrogen bondings such as the first one between H(17) and O(35) atoms i.e. N(12)–H(17)—O(35) [H(17)—O(35) = 1.7215 Å], second between H(20) and O(34) atoms i.e. N(14)–H(20)—O(34) [H(20)—O(34) = 1.6902 Å], and third one between H(11) and O(36) atoms i.e. C(10)–H(11)—O(36) [H(11)—O(36) = 2.6428 Å] have been observed. Three intramolecular hydrogen bondings were observed in L-histidine molecule itself between N(12) and (H(18) atoms i.e. N(12)–H(18)—O(15) [H(18)—O(15) = 2.9384 Å], N(12) and H(19) atoms i.e. N(12)–H(19)—O(15) [H(19)—O(15) = 1.9553 Å] and H(9) and O(16) atoms i.e. C(8)–H(9)—O(16) [H(9)—O(16) = 2.6788 Å], respectively. The bondings observed by HF as well as by other methods are given in Table 2 along with experimentally reported values (Natarajan et al., 2012) and it shows that molecular geometry obtained by HF is in good agreement than other methods. It may be mentioned here that by other applied methods only four bondings were observed. Because of a large number of hydrogen bondings and charge transfer in the titled molecule it is expected that it will show great NLO properties (Cole et al., 2001). The reason for the difference in bond lengths and angles is that the experimental values were obtained from the X-ray diffraction of the crystalline material in solid crystal form, though the geometry optimization of LH2NB was performed for an isolated molecule. The lowest value of C7–C8 (1.343 Å) less than the standard value (1.54 Å) of C–C bond length was observed. Correspondingly, the calculated shortest value for C–O bond length comes out to be 1.222 Å, which is less than the standard value (1.43 Å) of C–O bond length. The other bond lengths such as C–C, C–O, C–N, N–O, and C–H etc. in LH2NB are inside the range of typical values. The bond lengths of C–H are remain between 1.091 Å and 1.10 Å (Shkir and Abbas, 2014b).
3.2 Vibrational analysis
It is well known in the literature that the vibrational (Infrared and Raman) spectroscopic techniques have been widely applied by the organic chemists to study the functional groups, bonding to different molecular conformations and reaction mechanisms by tentatively assigning their observed fundamental modes (Teimouri et al., 2009; Colthup, 2012; Socrates, 2004; Dollish et al., 1974; Smith, 1998; Roeges, 1994). It is well known that when hydrogen (H), nitrogen (N), oxygen (O) etc. atoms are present between two molecules or within a molecule the inter-molecular and intra-molecular hydrogen bonding appears. The calculated IR and Raman spectra of LH2NB using HF and B3LYP methods are shown in Fig. 3. The theoretically calculated frequencies can be well matched with the experimentally observed frequencies by applying the scaling factor (for HF, 0.8929 and B3LYP, 0.9613) (Sinha et al., 2004; Alcolea Palafox, 2000; Shkir et al., 2015). IR and Raman frequencies of various theoretically predicted and experimentally observed peaks with their tentative assignment are listed in Table 3 and comparison exhibits strong agreement with the reported values.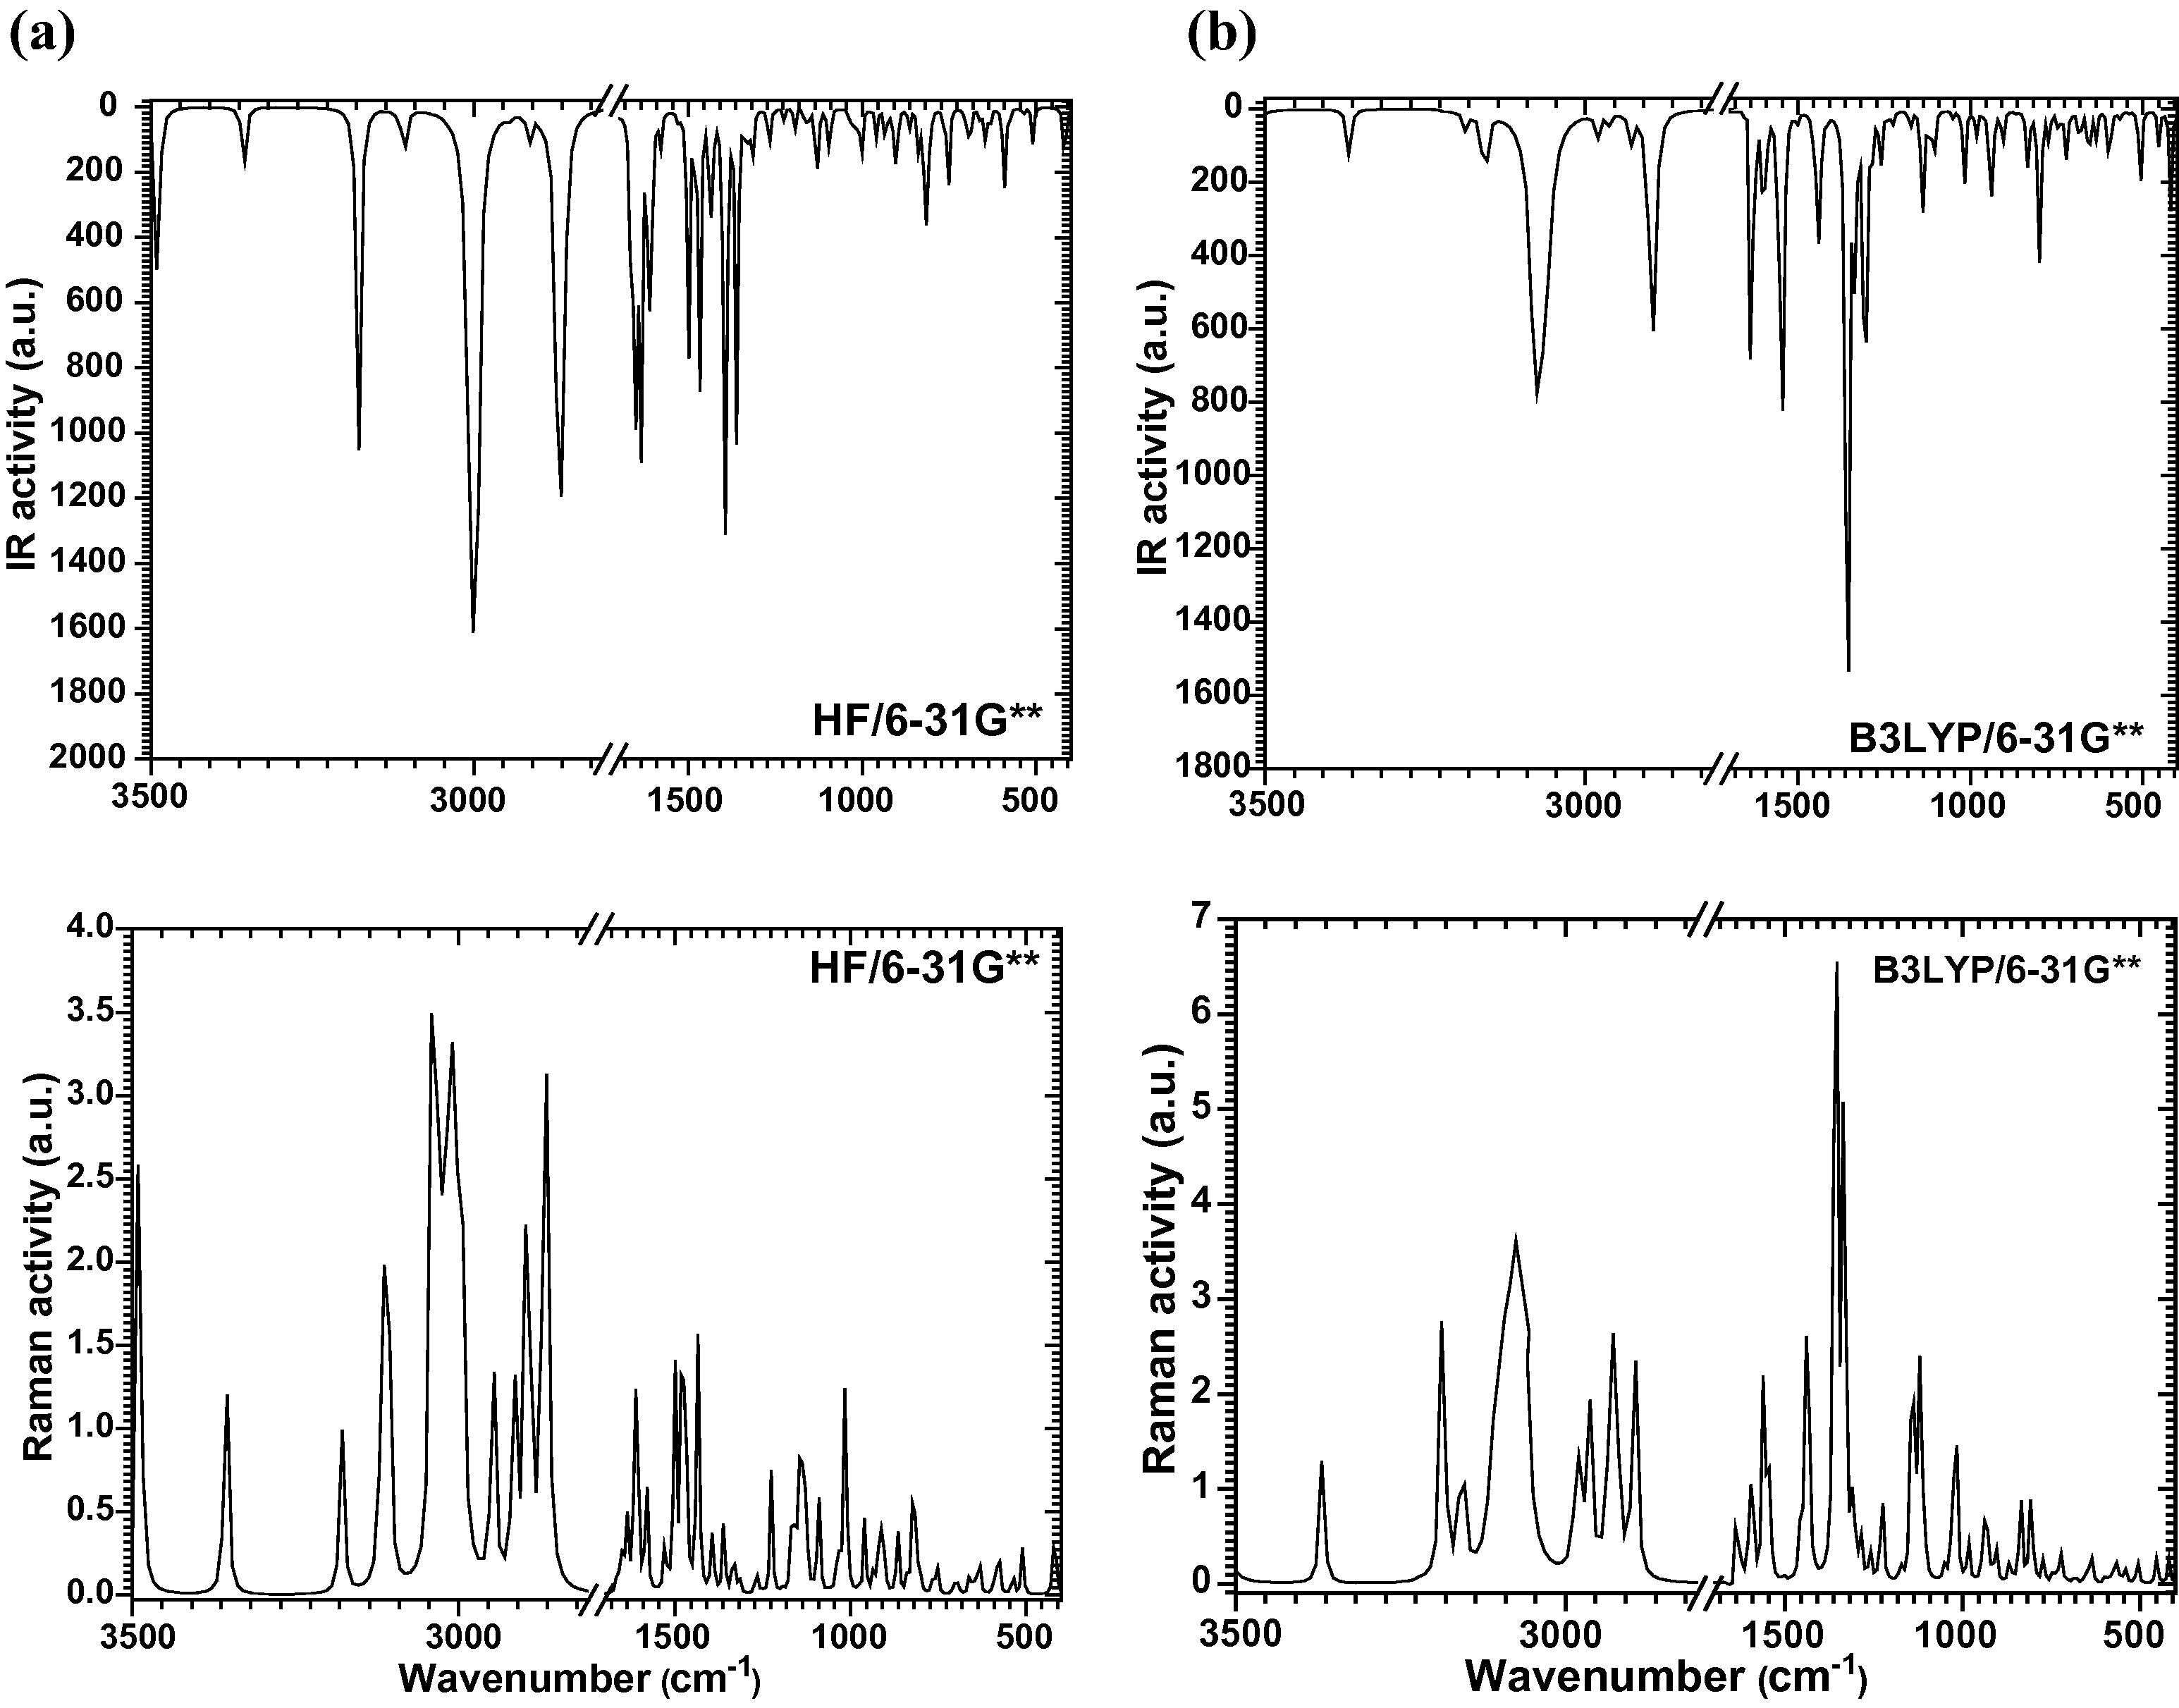
Calculated IR and Raman spectra of LH2NB by (a) HF and (b) B3LYP level of theory.
HF
B3LYP
Reported
HF
B3LYP
Calculated
IR freq. (Cm−1)Calculated
IR freq. (Cm−1)Experimental
IR freq.
(Cm−1) (Moovendaran et al., 2013)Calculated Raman freq. (Cm−1)
Calculated Raman freq. (Cm−1)
Assignments
3354
3370
–
3355
3369
NH3 asymmetric stretching
3177
3187
3173
3177
3187
NH symmetric stretching
3105
3153
3138
3113
3153
[NH3] Hydrogen bonded stretching mode
3001,2912,
28643075,2980,2962,
2928,28932970,2818
–3041,3009,2944,2912,2896,2864
3075,2962,
2928,2893CH2, NH3symmetric stretching
–
–
2478
2560,2363
–
2470
C–H combinational overtone
1650,1634
1639
1639
1634
1639
COO− asymmetric stretching
1610,1578
1604
1578
1610,1578
1595
NH3 symmetric stretching
–
1543
1533
1530
1561
N=C–N stretching
1498
1500
1491
1498,1482
–
Ring deformation
1433
1440
1421
1433
1440
COO− symmetric stretching
1393
1353
1377
1393,1361
1353
CH2 deformation
1361,1313
–1336
–1348
–1330
–1336
–NO2 symmetric stretching + C–C stretching
1265
1301
1288
1265
1310sh,1284
C–C stretching + C=O stretching
1225
1258,1223
1258
1225
1258,1223
C–H in plane bending + C–O bending
1192,1160,1128
1171sh,1137
1136
1144
1172sh,1137
C–H in plane bending
1096
1050
1067
1088
1052sh
Ring breathing, C–H in plane bending
1000,959,935,903
1016,981,938,903
1001,904
1016,959,911
1016,981,938,903
N–H bending
839
834
831
860
834
C–C stretching
815
799
785
823
808
COO− bending vibration
750
747,721
754
750
748,721
CCC in plane bending
694
690
694
694
–
NO2 wagging
662
687
667
662
687
NO2 rocking
646
653
652
–
–
COO− wagging
630
634
629
630
635
Ring deformation
590
600,566
575
574
600sh,566,540
C–NO2 stretching
509
505
519
509
505
COO− wagging
421
419
422
421
419
CCC out of plane bending
The vibrational modes present in the molecule at ∼3177, 3187 cm−1 in HF and B3LYP respectively, are due to NH symmetric stretching vibration. In the similar manner the band observed at 3105, 3113 cm−1, and 3153 cm−1 have been tentatively assigned to NH3 stretching vibration mode. The CH2, NH3 symmetric stretching vibrations are observed in the region of 2800–3001 cm−1. The band at 2478, 2470 cm−1observed in Raman not in IR may be assigned to C–H combinational overtone. The COO− ions of carboxylic group shows asymmetric and symmetric stretching characteristic modes at 1650, 1634, 1639 cm−1 and 1433, 1440 cm−1 in IR and Raman respectively. COO− bending and wagging vibration modes were observed at 815, 799 cm−1 and 823, 808 cm−1 in IR transmittance and Raman spectra respectively. The band observed at 1393, 1361 cm−1 and 1353 cm−1 have been assigned to CH2 deformation. The asymmetric and symmetric stretching modes of NO2 functional group is expected in the region of 1370–1330 cm−1 and observed at 1361, 1313 cm−1 and 1330, 1336 cm−1 in these IR transmittance and Raman spectra respectively. The wagging and rocking modes of vibration of NO2 group are observed at 694 cm−1and 690 cm−1. The other vibration modes observed in LH2NB molecule are tentatively assigned in Table 3 which exhibits very well correlation between theoretically calculated and experimentally observed peaks in their respective IR and Raman spectra.
3.3 Optical (TD-DFT) study
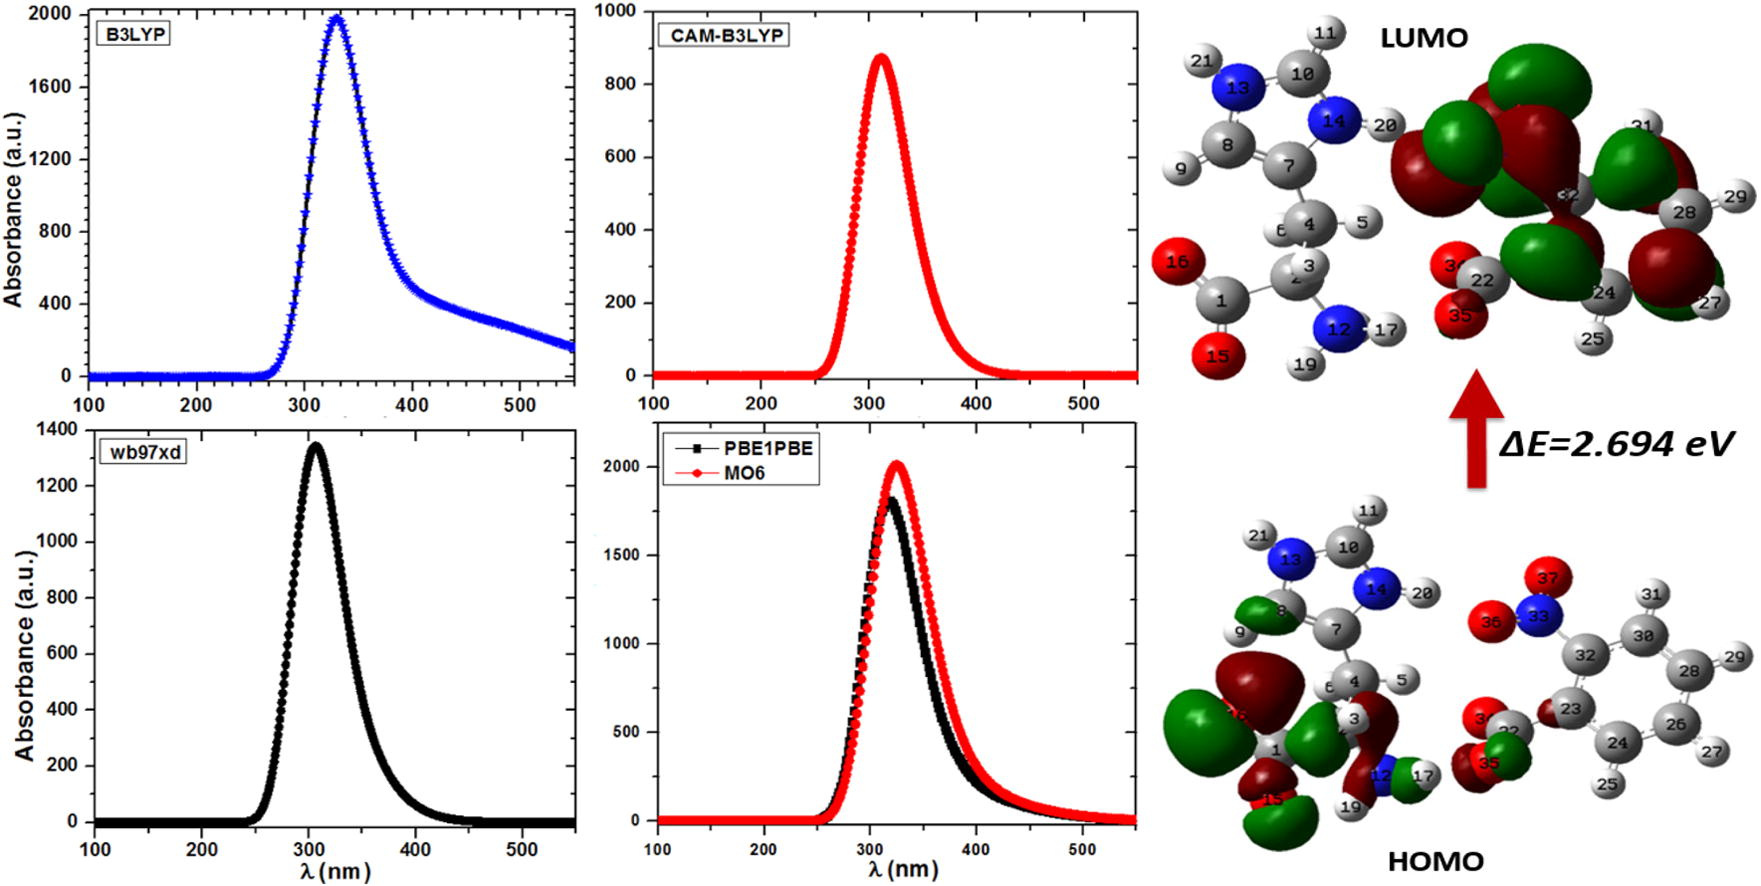
Time dependent DFT (TD-DFT) is one of the broad approaches in quantum chemistry as well as in solid state physics to calculate the excited state electronic structure. The contemporary DFT methods display a promising stability between accuracy and computational efficiency, when equated to the traditional ab initio and semi-empirical approaches. To examine the kind of electronic transition in LH2NB molecule in gas phase, the TD-DFT has been applied at different functional. As almost precise absorption wavelength can be easily detected at relatively small computing time by such study on the basis of optimized ground state geometry, which is related to the vertical electronic transitions (Kostova et al., 2010; Jacquemin et al., 2005, 2004; Cossi and Barone, 2001). The UV-Vis spectrum was also calculated for the optimized geometry at TD-HF level of theory using 6-31G∗∗ basis set as shown in Figure 1S (see supplementary data). Absorption wavelength, excitation energies, oscillator strengths and dipole moments were evaluated at the ground state of the optimized geometries using TD-B3LYP, TD-CAM-B3LYP, TD-wb97xd, TD-PBE0, TD-M06 levels of theory using 6-31G∗∗ basis set. These calculated values are presented in Tables 4 and 5. The calculated UV–Vis spectrum of LH2NB has only one absorption band at all applied functional as shown in Fig. 4. The value of excitation wavelength is found to be ∼328.19 (3.778 eV), 309.07 (4.012 eV), 310.64 (3.990 eV) nm, 317 (3.935 eV) nm and 324 (3.820 eV) nm calculated at B3LYP, CAM-B3LYP, wb97xd, PBE0 and MO6 levels of theory using 6-31G∗∗ basis set, respectively. The oscillatory strength describes the strength of optical or molecular interactions. The value of
for the titled molecule is found to be between 0.02 to 0.05 obtained at all applied methods. The value of
is used to compare a quantum mechanical transition to that expected by a fully allowed set of classical electromagnetic oscillators. The value of
, represents a strong transition while generally a quantum mechanically forbidden transition may have
. It may be mentioned here that the optimized co-ordinate at B3LYP has been used in PBE0 and MO6. In experimentally reported result on optical transmission there is a absorption band at about 300 nm (Moovendaran et al., 2013), which is in good agreement with the theoretical value calculated at almost all levels of theory, however it is more close to CAM-B3LYP. The present study reveals that the titled compound owns the property of extended ultraviolet–visible transmittance (Govindarajan et al., 2011; Srinivasan et al., 2006). The obtained high excitations energy (or optical absorption spectra which help us to determine the optical transparency and band gap of the materials) is maybe useful in various optoelectronic devices (Shkir et al., 2014; Kushwaha et al., 2011; Shakir et al., 2009; Kushwaha et al., 2014). The optical band gap was calculated by using Tauc’s relation from the absorption spectra obtained from B3LYP and found to be about 3.3 eV. This shows that the titled material possesses high band gap in comparison to other optical materials as well as comparable (Shkir et al., 2014; Babu et al., 2010; Klimm, 2014) and can be used in optical devices. The change in the dipole moment (Table 5) upon excitation was observed which may be due to charge redistribution within HOMO and LUMO orbitals of LH2NB molecule. The titled molecule has less polar excited state than the ground state as the value of dipole moment is higher in the ground state.
Functional
λ (nm)
E (eV)
B3LYP
328.19
3.778
0.0450
CAM-B3LYP
309.07
4.012
0.0202
wb97xd
310.64
3.991
0.0225
PBE0
317
3.935
0.0377
M06
324
3.820
0.0386
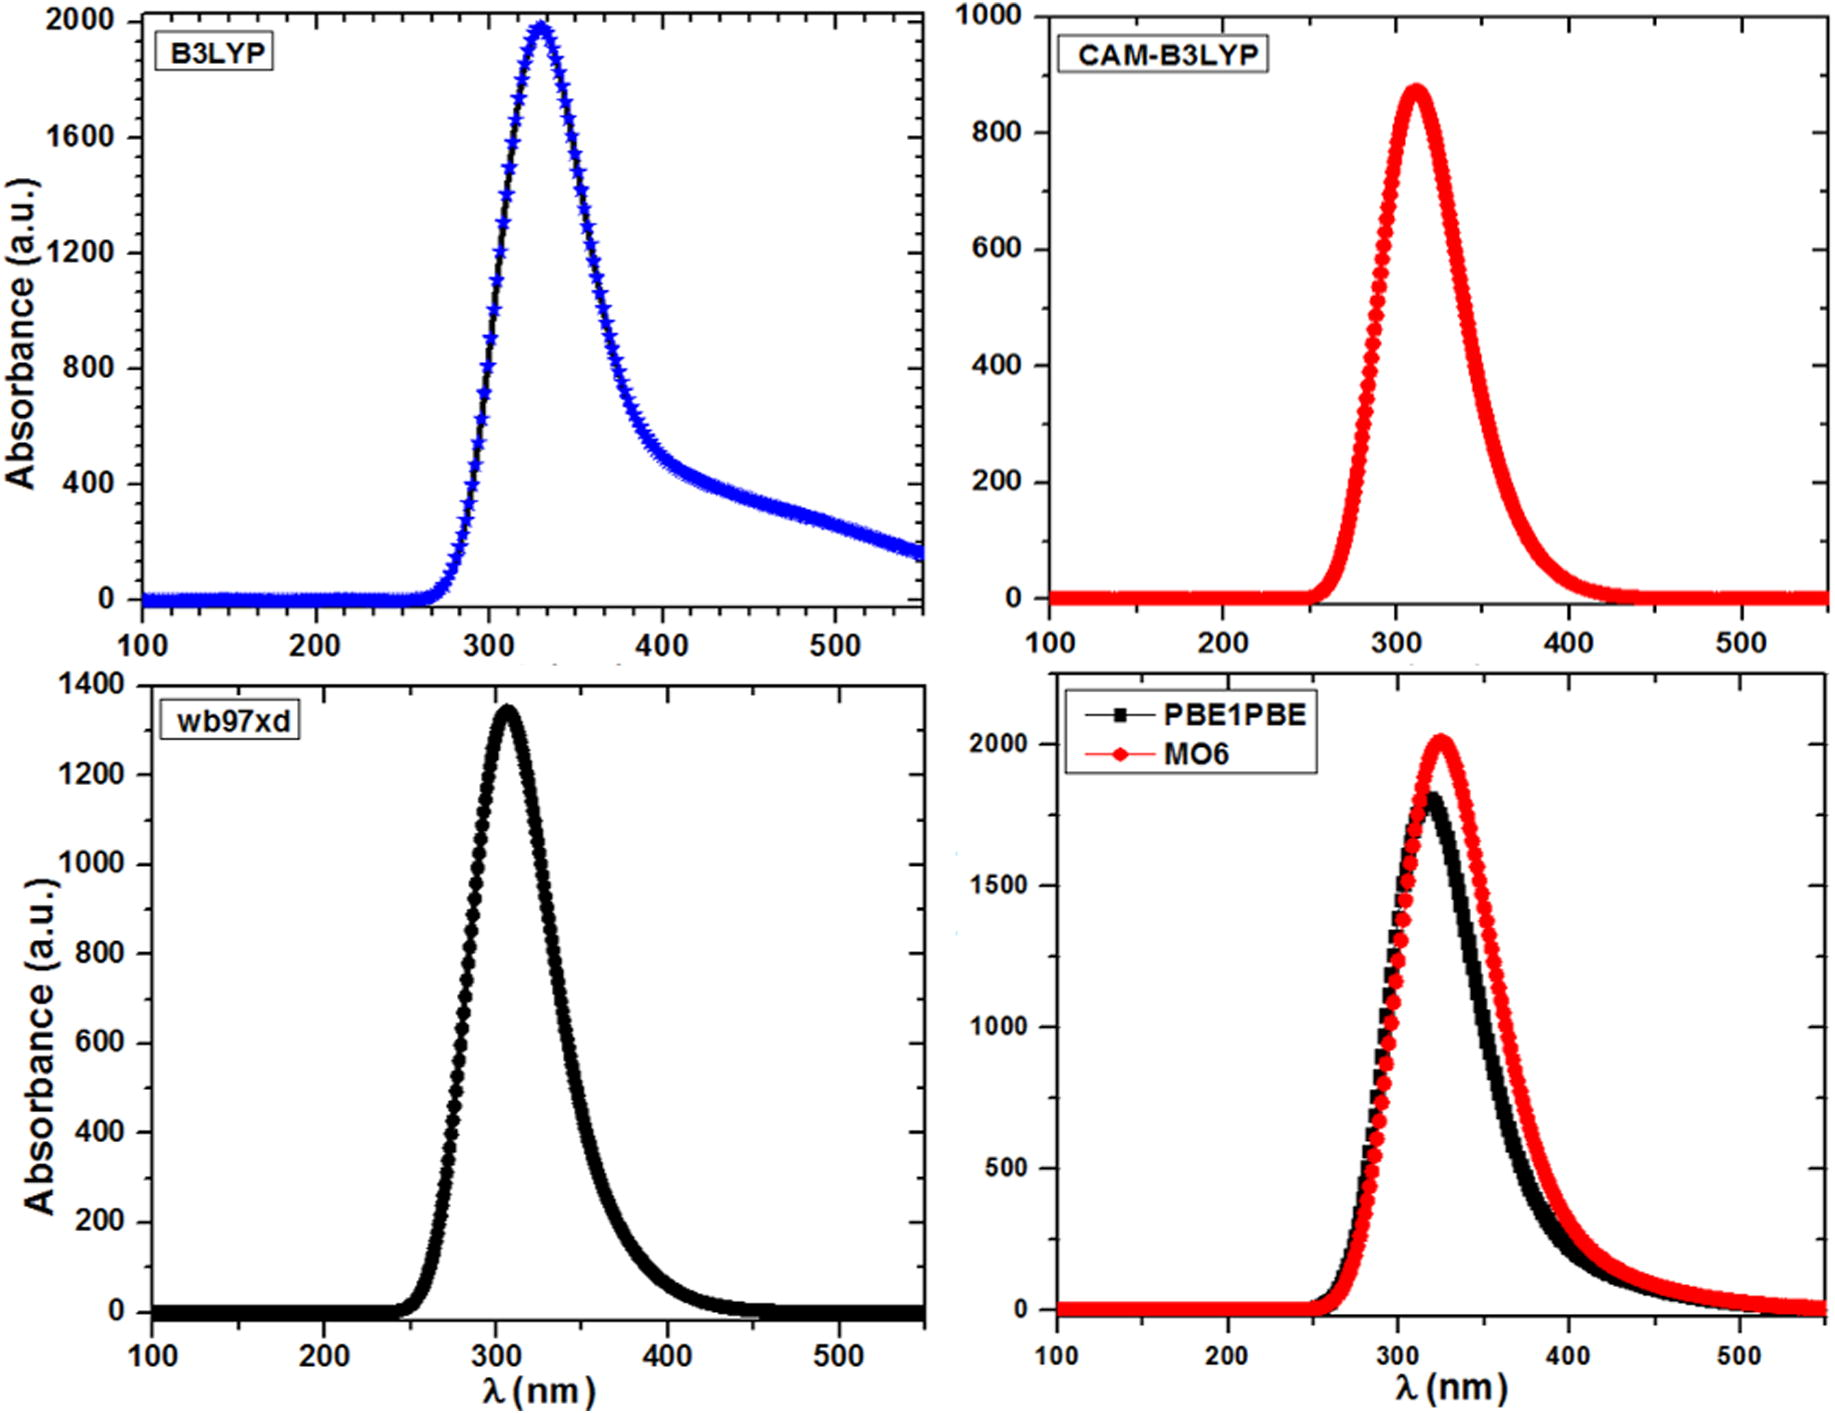
Calculated optical absorption spectra of LH2NB molecule at different levels of theory.
3.4 HOMO–LUMO gap and GCRD analysis
It is very important to study the frontier molecular orbitals (FMOs) as they play a significant character in the reactivity of any molecule. The interactions of HOMO and LUMO in reacting species throughout the progression of chemical reactions are essential among FMOs in stabilization of transition structure. Chemical reactivity, kinetic stability, optical polarizability and chemical softness can be described by HOMO–LUMO energy gap values of any molecular system. It is well known that larger the energy gap the harder the material and also shows higher thermal and kinetic stability according to softness–hardness rule. The energy values of HOMO and LUMO orbitals calculated by the B3LYP method are found to be −5.442 and −2.748 eV, respectively. The value of HOMO–LUMO gap is 2.694 eV with chemical hardness 1.347 eV, indicates that the titled material has good chemical stability.
TD-DFT results revealed the excitation energy about 3.778, 3.836 and 3.990 eV calculated by B3LYP, CAM-B3LYP, wb97xd, PBE0/PBE1PBE and MO6 levels of theory viz. corresponding to the electronic transition from ground state to excited state and displays that the charge transfer from L-Histidine to 2-nitrobenzoate ligand counterparts. Fig. 5 shows the 3-D plot of HOMO–LUMO orbitals and their respective values are presented in Table 6, determined at B3LYP/6-31G∗∗ level of theory. The HOMO–LUMO orbitals were also obtained at HF/6-31G∗∗ level of theory and their 3-D plot of is shown in Figure 2S (see supplementary data). From the figure it is clearly visible that the HOMO are localized at the lower part of L-Histidine and COO group of 2-nitrobenzoate molecule while LUMO are localized on 2-nitrobenzoate molecule only. LH2NB has an advantage of noteworthy transparency and low absorbance as experimentally proved (Moovendaran et al., 2013).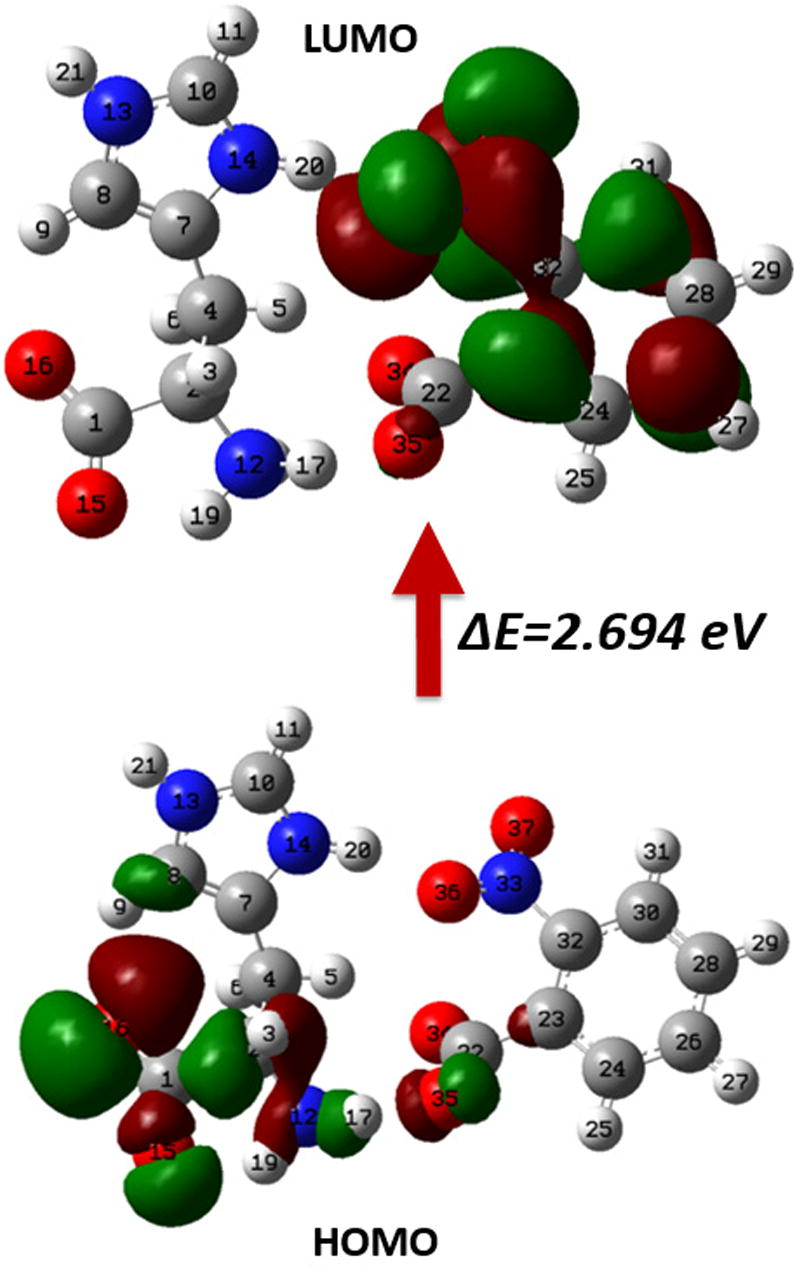
The 3-D plot of HOMO–LUMO orbitals of LH2NB molecule at isoval = ±0.02 a.u.
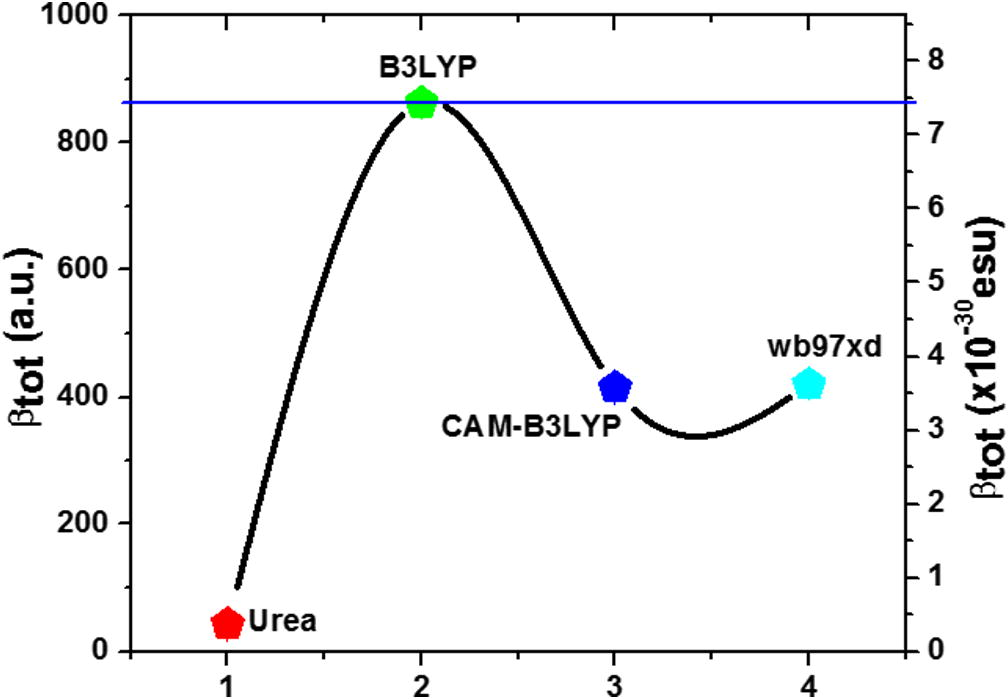
Variation of βtot values calculated at different methods in comparison with urea.
B3LYP
Orbitals
a.u.
eV
EHOMO
−0.200
−5.442
EHOMO−5
−0.243
−6.612
EHOMO−1
−0.211
−5.742
ELUMO
−0.101
−2.748
ELUMO+1
−0.058
−1.578
ΔEHOMO–LUMO
0.099
2.694
ΔEHOMO−5–LUMO
0.142
3.864
ΔEHOMO−1−LUMO+1
0.153
4.163
η
0.05
1.347
μ
−0.151
−4.095
s
0.074
2.020
χ
0.151
4.095
ω
0.229
6.225
Further the global chemical reactivity descriptor (GCRD) parameters were calculated as these are used to identify the connection regarding structure, stability and global chemical reactivity of any molecule. GCRD parameters are used in quantitative structure–property, structure–activity, structure–toxicity analysis and a relationship between aromaticity and hardness (Vektariene et al., 2009). DFT has been used in the present study which delivers the interpretations of important universal insights into stability and reactivity of molecular structure (Pearson, 1987). The GCRD (such as hardness (η), chemical potential (μ), softness (S), electronegativity (χ) and electrophilicity index (ω)) of LH2NB molecule have been calculated with the help of EHOMO as ionization potential (I) and ELUMO as electron affinity (I) respectively. The calculated values of GCRD parameters for LH2NB molecule are presented in Table 6. Thermodynamic properties were also calculated at constant temperature (298.150 K) and pressure (1.000 Atm.) as given in Table 7. The results show that the titled material has good thermal stability.
Methods
E (Thermal) (KCal/Mol)
CV (Cal/Mol-Kelvin)
S (Cal/Mol-Kelvin)
HF
204.003
71.220
151.059
B3LYP
189.505
76.461
153.956
CAM-B3LYP
192.504
75.144
152.836
Wb97xd
192.562
74.984
149.904
3.5 NLO (polarizability and first order hyperpolarizability) effect
The NLO processes are of technological significance in the production of laser devices, therefore in recent decade it is considered as a key subject of study, in which hyperpolarizability played a vital role and maintains the growing application and adoring to the exact determination of this property (Bishop, 1994; Prasad and Williams, 1991). As per the available literature numerous current studies display that besides a suitable action of electron correlation and a careful selection of the basis set function, the calculations of molecular electrical properties like polarizability and hyperpolarizability the inclusion of contributions arising from the nuclear motion is of fundamental importance (Ingamells et al., 1998; Raptis et al., 1999; Eckart et al., 2001).
Author know that the importance of the polarizability and first hyperpolarizability values of any molecule is reliant on the efficiency of electronic communication between acceptor and donor groups as these are the key elements in molecular charge transfer (Udayakumar et al., 2011; Wolinski et al., 1990; Cheeseman et al., 1996; Kalinowski et al., 1988; Pihlaja et al., 1994). To calculate the linear and nonlinear optical properties of LH2NB molecule author have applied B3LYP, CAM-B3LYP and wb97xd levels of theory using 6-31G∗∗ basis set. The calculated values of electronic dipole moment (μ), total average polarizability (αtot), anisotropy of polarizability (Δα), static first hyperpolarizability (β0) and total first hyperpolarizability (βtot) are presented in Table 7 at B3LYP/6-31G∗∗ level of theory. The above said values calculated by other methods are presented in Tables 8–10.
Components
a.u.
esu (×10−24)
Component
a.u.
esu (×10−30)
αxx
247.415
36.667
βxxx
26.530
0.229
αxy
−4.757
−0.705
βxxy
458.966
3.960
αyy
205.029
30.385
βxyy
29.511
0.255
αxz
3.504
0.519
βyyy
706.008
6.092
αyz
−6.248
−0.926
βxxz
−39.513
−0.341
αzz
97.932
14.514
βxyz
35.165
0.303
αtot
183.459
27.189
βyyz
24.906
0.215
Δα
133.576
19.795
βxzz
22.689
0.196
μx
1.296
−3.292D
βyzz
22.695
0.196
μy
4.395
11.163D
βzzz
−6.459
−0.056
μz
0.711
−1.805D
β0
517.805
4.468
μtot
4.637
11.777D
βtot
863.008
7.447
μurea
0.541
1.3732D (Govindarasu and Kavitha, 2014; Shkir and et al., 2015b)
βurea
43.203
0.3728 (Govindarasu and Kavitha, 2014; Shkir and et al., 2015b)
Components
a.u.
esu (×10−24)
Component
a.u.
esu (×10−30)
αxx
230.762
34.199
βxxx
−140.742
−1.215
αxy
−2.754
−0.408
βxxy
211.661
1.826
αyy
192.930
28.592
βxyy
3.060
0.026
αxz
3.726
0.552
βyyy
421.943
3.64
αyz
−7.240
−1.073
βxxz
−40.938
−0.353
αzz
100.936
14.958
βxyz
28.431
0.245
αtot
174.876
25.916
βyyz
26.563
0.229
Δα
115.993
17.19
βxzz
16.941
0.146
μx
1.404
−3.329D
βyzz
19.055
0.164
μy
4.462
11.058D
βzzz
−8.906
−0.077
μz
0.820
−2.053D
β0
249.067
2.149
μtot
4.749
11.730D
βtot
415.112
3.582
μurea
0.541
1.3732D (Govindarasu and Kavitha, 2014; Shkir and et al., 2015b)
βurea
43.203
0.3728 (Govindarasu and Kavitha, 2014; Shkir and et al., 2015b)
Components
a.u.
esu (×10−24)
Component
a.u.
esu (×10−30)
αxx
233.588
34.618
βxxx
−144.983
−1.251
αxy
−3.531
−0.523
βxxy
243.199
2.099
αyy
194.649
28.847
βxyy
−10.829
−0.093
αxz
3.173
0.47
βyyy
413.895
3.571
αyz
−7.131
−1.057
βxxz
−35.636
−0.307
αzz
99.735
14.781
βxyz
26.934
0.232
αtot
175.991
26.082
βyyz
31.685
0.273
Δα
119.377
17.692
βxzz
20.229
0.175
μx
1.354
−3.441D
βyzz
18.165
0.156
μy
4.545
11.553D
βzzz
−9.987
−0.086
μz
0.817
−2.076D
β0
252.070
2.175
μtot
4.812
12.232D
βtot
420.116
3.625
μurea
0.541
1.3732D (Govindarasu and Kavitha, 2014; Shkir and et al., 2015b)
βurea
43.203
0.3728 (Govindarasu and Kavitha, 2014; Shkir and et al., 2015b)
The different mathematical expressions are used to calculate the above parameters as expressed below:
Total dipole moment is calculated by:
Total polarizability is calculated by:
Anisotropy of polarizability is calculated by:
The components of first hyperpolarizability can be calculated using the following relation:
Using x, y, z components the magnitude of first hyperpolarizability (βtot) can be achieved by:
So, the final equation for magnitude of total first hyperpolarizability calculation is given by:
First hyperpolarizability can be labeled as a 3 × 3 × 3 matrix as it is known as a third rank tensor and 27 components of the 3D matrix are reduced to 10 components due to the Kleinman symmetry (Kleinman, 1962), and can be specified in lower tetrahedral format as it is evident that the lower part of 3 × 3 × 3 matrices is tetrahedral. Further, the static first hyperpolarizability (β0) was also calculated using the following relation and given in Table 7. The electronic communication of two different parts of any system plays a key role in polarizability and hyperpolarizability values. Calculated values of all components and their resultants of dipole moment, polarizability and hyperpolarizability by B3LYP/6-31G∗∗ are given in Table 7 (in a.u and esu (for α, 1 a.u. = 0.1482 × 10⁻²⁴ esu and for β, 1 a.u. = 0.008629 × 10⁻³⁰ esu)) (Govindarasu and Kavitha, 2014; Shkir et al., 2015b). The value of μtot and βtot at molecular level are found to be 8 times and 20 times higher than urea (μUrea = 1.3732D and βurea = 0.3728 × 10⁻³⁰ esu) (Govindarasu and Kavitha, 2014; Shkir et al., 2015b) respectively. These values are higher than many other organic, semiorganic and inorganic materials also (Shkir et al., 2014, 2015b; Adant et al., 1995; Karabacak and Cinar, 2012; Raju et al., 2015; Abbas et al. 2015; Singh et al., 2012; Govindarasu et al., 2014). Further, these values were calculated by exchange correlation functional CAM-B3LYP and wb97xd level of theory with 6-31G∗∗ basis set and presented in Table 8 and 9. In recent reports the experimental value of second harmonic generation of LH2NB was found to be 2 times higher than KDP at bulk level (Moovendaran et al., 2013; Natarajan et al., 2012). The representation of variation of first order hyperpolarizability calculated at all the methods with reference to urea is shown in Fig. 6. Therefore, from both experimental and theoretical studies it is evident that the titled compound is a very good nonlinear optical material and can be useful for laser device applications.
3.6 Molecular electrostatic potential (MEP) analysis
Fig. 7 shows the MEP (3-D plot) of LH2NB molecule. MEP plays a very important role in understanding many points such as: (i). About its positive and negative regions as nucleophile and electrophile at molecular level(Murray and Sen, 1996; Scrocco and Tomasi, 1978), (ii). It is a measurement of electrostatic potential on constant electron density surface, (iii). It is also a very useful property to examine the reactivity of molecular species by guessing that either the approaching nucleophile is attracted to a positive region of the molecular system (iv). It will also help to know the simultaneous information about the molecular size, shape along with its positive, negative and neutral electrostatic potential regions in terms of color grading (Murray and Sen, 1996; Lowdin, 1979). The MEP plot was also determined at HF/6-31G∗∗ level of theory and shown in Figure 3S (see supplementary data). The red and blue colors on surface shows highest negative and positive potential respectively.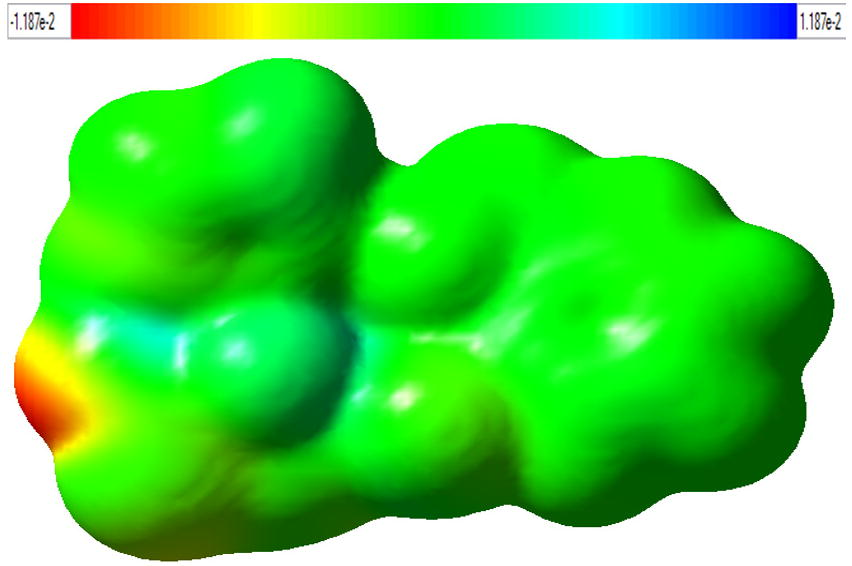
MEP plot of LH2NB molecule at ISO value 0.02.
The COO group of L-Histidine shows the negative potential as represented by red as well as yellow colors which is favorable for electrophilic attack while near the other atoms, it has positive potential with blue color and favorable for nucleophilic attack. The yellow color on the surface shows intermediate negative potential. The green color represents the slight positive or neutral potential over the carbon atoms.
4 Conclusions
The stable geometry of LH2NB molecule has been achieved and the optimized structural parameters were found in good agreement with the reported experimental values. The calculated vibrational modes of LH2NB are found in strong agreement with earlier experimental reports. The excitation energy of LH2NB molecule was calculated by TD-B3LYP, TD-CAM-B3LYP, TD-wb97xd, TD-PBE0 and TD-MO6 using 6-31G∗∗ basis set, and found to be 3.778, 4.012, 3.991, 3.935 and 3.820 eV and with an oscillatory strength of 0.045, 0.020, 0.023, 0.0377 and 0.0386 respectively. The charge interaction taking place within the molecule has been studied from HOMO–LUMO orbitals and energy gap was calculated. The chemical and thermal stability of LH2 NB has been studied with help of global chemical reactivity descriptors and thermodynamic parameters. The value of dipole moment is found to be lower in the excited state than ground state and shows that the ground state is more polar than excited state. The μtot and βtot values are found to be 8 and 20 times higher than standard urea molecule at molecular level respectively. The molecular electrostatic potential plot shows that the negative potential sites are on electronegative oxygen atoms of COO group and positive potential sites are on hydrogen atoms. The higher total first hyperpolarizability indicates that the studied compound is maybe an excellent candidate for laser device applications.
Acknowledgement
The authors are thankful to Dr. I.S. Yahia, Nano-Science & Semiconductor Labs., Faculty of Education, Ain Shams University, Roxy, Cairo, Egypt, for supporting the calculations with Gaussian 09 software.
References
- Density functional study of spectroscopy (IR), electronic structure, linear and nonlinear optical properties of L-proline lithium chloride and L-proline lithium bromide monohydrate: For laser applications. Arab. J. Chem. 2015
- [CrossRef] [Google Scholar]
- Toward reliable density functional methods without adjustable parameters: the PBE0 model. J. Chem. Phys.. 1999;110(13):6158-6170.
- [Google Scholar]
- Ab initio study of the nonlinear optical properties of urea: electron correlation and dispersion effects. Int. J. Quantum Chem.. 1995;56(S29):497-507.
- [Google Scholar]
- Structural, vibrational and theoretical studies of l-histidine bromide. J. Mol. Struct.. 2008;888(1):180-186.
- [Google Scholar]
- Scaling factors for the prediction of vibrational spectra. I. Benzene molecule. Int. J. Quantum Chem.. 2000;77(3):661-684.
- [Google Scholar]
- Crystal growth and characterization of semiorganic single crystals of L-histidine family for NLO applications. J. Cryst. Growth. 2011;322(1):69-73.
- [Google Scholar]
- Vibrational spectroscopic studies and DFT calculations of 4-bromo-o-xylene. Spectrochim. Acta Part A Mol. Biomol. Spectrosc.. 2012;91:419-430.
- [Google Scholar]
- Growth and characterization of semi organic nonlinear optical LHPCL crystals. Cryst. Res. Technol.. 2007;42(2):180-185.
- [Google Scholar]
- Synthesis, growth, structural, thermal, linear and nonlinear optical properties of a new organic crystal: dimethylammonium picrate. J. Cryst. Growth. 2010;312(12):1957-1962.
- [Google Scholar]
- Density-functional thermochemistry. III. The role of exact exchange. J. Chem. Phys.. 1993;98:5648-5652.
- [Google Scholar]
- Synthesis, crystal growth and characterization of 3-methyl 4-nitropyridine 1-oxide (POM) single crystals. J. Cryst. Growth. 2004;261(1):55-62.
- [Google Scholar]
- Systematic optimization of long-range corrected hybrid density functionals. J. Chem. Phys.. 2008;128:084106.
- [Google Scholar]
- A comparison of models for calculating nuclear magnetic resonance shielding tensors. J. Chem. Phys.. 1996;104(14):5497-5509.
- [Google Scholar]
- Nonlinear Optical Properties of Organic Molecules and Crystals. Vol vol. 1. Elsevier; 2012.
- A comparative study of selected disperse azo dye derivatives based on spectroscopic (FT-IR, NMR and UV–Vis) and nonlinear optical behaviors. Spectrochim. Acta Part A Mol. Biomol. Spectrosc.. 2014;122:682-689.
- [Google Scholar]
- Influence of hydrogen bonding on the second harmonic generation effect: neutron diffraction study of 4-nitro-4’-methylbenzylidene aniline. Acta Crystallogr. B. 2001;57(3):410-414.
- [Google Scholar]
- Introduction to Infrared and Raman Spectroscopy. Elsevier; 2012.
- Time-dependent density functional theory for molecules in liquid solutions. J. Chem. Phys.. 2001;115(10):4708-4717.
- [Google Scholar]
- Speciation of gold (III)–L-histidine complex: a multi-instrumental approach. This is the work of United States government employees engaged in their official duties. As such it is in the public domain and exempt from copyright.© US government. J. Environ. Monit.. 2000;2(4):355-359.
- [Google Scholar]
- Growth and characterization of a solution grown, new organic crystal: l-histidine-4-nitrophenolate 4-nitrophenol (LHPP) J. Cryst. Growth. 2010;313(1):30-36.
- [Google Scholar]
- Growth and characterization of two new NLO materials from the amino acid family: l-Histidine nitrate and l-Cysteine tartrate monohydrate. Opt. Commun.. 2008;281(3):457-462.
- [Google Scholar]
- Growth and characterization of a new organic non-linear optical (NLO) material: L-histidinium trifluoroacetate. Open Crystal. J.. 2008;1:46-50.
- [Google Scholar]
- Characteristic Raman Frequencies of Organic Compounds. Wiley; 1974.
- Failure of time-dependent density functional theory for long-range charge-transfer excited states: The Zincbacteriochlorin−Bacteriochlorin and Bacteriochlorophyll−Spheroidene complexes. J. Am. Chem. Soc.. 2004;126:4007-4016.
- [Google Scholar]
- Vibrational effects on electric properties of cyclopropenone and cyclopropenethione. J. Chem. Phys.. 2001;114(2):735-745.
- [Google Scholar]
- HF, MP2 and DFT calculations and spectroscopic study of the vibrational and conformational properties of N-diethylendiamine. Spectrochim. Acta Part A Mol. Biomol. Spectrosc.. 2007;68(3):942-947.
- [Google Scholar]
- Investigation of the structure of solution grown crystals of lactide copolymers by means of chemical reactions. Kolloid-Zeitschrift und Zeitschrift für Polymere. 1973;251:980-990.
- [Google Scholar]
- Nonempirically tuned range-separated DFT accurately predicts both fundamental and excitation gaps in DNA and RNA nucleobases. J. Chem. Theory Comput.. 2012;8:2682-2687.
- [Google Scholar]
- Frisch, M.J., et al., Gaussian 09, Revision B.01. 2009, Wallingford CT.
- Second order nonlinear optical properties of the single crystal of N-Benzyl 2-methyl-4-nitroaniline: Anomalous enhancement of the d333 component and its possible origin. Jpn. J. Appl. Phys.. 2006;45(11R):8676.
- [Google Scholar]
- Role of long-range intermolecular forces in the formation of inorganic nanoparticle clusters. J. Phys. Chem. A. 2011;115:12933-12940.
- [Google Scholar]
- Experimental (FT-IR and FT-Raman), electronic structure and DFT studies on 1-methoxynaphthalene. Spectrochim. Acta Part A Mol. Biomol. Spectrosc.. 2011;79(3):646-653.
- [Google Scholar]
- Vibrational spectra, molecular structure, NBO, UV, NMR, first order hyperpolarizability, analysis of 4-Methoxy-4′-Nitrobiphenyl by density functional theory. Spectrochim. Acta Part A Mol. Biomol. Spectrosc.. 2014;122:130-141.
- [Google Scholar]
- Synthesis, structural, spectral (FTIR, FT-Raman, UV, NMR), NBO and first order hyperpolarizability analysis of N-phenylbenzenesulfonamide by density functional theory. Spectrochim. Acta Part A Mol. Biomol. Spectrosc.. 2014;133:417-431.
- [Google Scholar]
- The electronic, vibrational and rotational contributions to the dipole moment, polarizability, and first and second hyperpolarizabilities of the BH molecule. J. Chem. Phys.. 1998;109(5):1845-1859.
- [Google Scholar]
- Theoretical investigation of substituted anthraquinone dyes. J. Chem. Phys.. 2004;121(4):1736-1743.
- [Google Scholar]
- A TD-DFT study of the absorption spectra of fast dye salts. Chem. Phys. Lett.. 2005;410(4):254-259.
- [Google Scholar]
- The performance of a family of density functional methods. J. Chem. Phys.. 1993;98(7):5612-5626.
- [Google Scholar]
- Kalinowski, H.-O., Berger, S., Braun, S., 1988. Carbon-13 NMR spectroscopy.
- FT-IR, FT-Raman, UV spectra and DFT calculations on monomeric and dimeric structure of 2-amino-5-bromobenzoic acid. Spectrochim. Acta Part A Mol. Biomol. Spectrosc.. 2012;86:590-599.
- [Google Scholar]
- Electronic materials with a wide band gap: recent developments. IUCrJ. 2014;1(5):281-290.
- [Google Scholar]
- Ordering of wave functions and eigenenergies to the individual electrons of an atom. Physica. 1933;1(1):104-113.
- [Google Scholar]
- Molecular first order hyperpolarizability and vibrational spectral investigation of Warfarin sodium. Chem. Phys.. 2010;378(1):88-102.
- [Google Scholar]
- The effect of Cr3+ doping on the crystalline perfection and optical properties of zinc tris (thiourea) sulfate, a nonlinear optical material. J. Appl. Crystallogr.. 2011;44(5):1054-1061.
- [Google Scholar]
- Au 9+ swift heavy ion irradiation of Zn [CS (NH 2) 2] 3 SO 4 crystal: crystalline perfection and optical properties. Nucl. Instrum. Methods Phys. Res., Sect. B. 2014;338:1-7.
- [Google Scholar]
- Generation of high-peak-power tunable infrared femtosecond pulses in an organic crystal: application to time resolution of weak infrared signals. JOSA B. 1987;4(6):987-997.
- [Google Scholar]
- Development of the Colle-Salvetti correlation-energy formula into a functional of the electron density. Phys. Rev. B. 1988;37:785.
- [Google Scholar]
- Advances in Quantum Chemistry. Vol vol. 11. Academic Press; 1979.
- Growth and characterization of a novel NLO crystal l-histidine hydrofluoride dihydrate (LHHF) J. Cryst. Growth. 2006;293(2):409-414.
- [Google Scholar]
- Growth and characterization of L-histidine hydrochloride monohydrate single crystals. Cryst. Res. Technol.. 2007;42(1):59-64.
- [Google Scholar]
- Growth and characterization of a new nonlinear optical l-histidine acetate single crystals. Opt. Mater.. 2007;29(9):1211-1216.
- [Google Scholar]
- Structural, vibrational and thermal studies of a new nonlinear optical material: l-Asparagine-l-tartaric acid. Spectrochim. Acta Part A Mol. Biomol. Spectrosc.. 2012;92:388-391.
- [Google Scholar]
- Growth and characterization of L-histidinium 2-nitrobenzoate single crystals: a new NLO material. Optik-Int. J. Light Electron Opt.. 2013;124(17):3117-3119.
- [Google Scholar]
- Molecular Electrostatic Potentials: Concepts and Applications. Vol vol. 3. Elsevier; 1996.
- Absolute hardness: companion parameter to absolute electronegativity. J. Am. Chem. Soc.. 1983;105(26):7512-7516.
- [Google Scholar]
- Absolute electronegativity and absolute hardness of Lewis acids and bases. J. Am. Chem. Soc.. 1985;107(24):6801-6806.
- [Google Scholar]
- Recent advances in the concept of hard and soft acids and bases. J. Chem. Edu.. 1987;64(7):561.
- [Google Scholar]
- Carbon-13 NMR Chemical Shifts in Structural and Stereochemical Analysis. VCH Publishers; 1994.
- Introduction to nonlinear optical effects in molecules and polymers. New York: Wiley; 1991.
- FT-IR, molecular structure, first order hyperpolarizability, MEP, HOMO and LUMO analysis and NBO analysis of 4-[(3-acetylphenyl) amino]-2-methylidene-4-oxobutanoic acid. Spectrochim. Acta Part A Mol. Biomol. Spectrosc.. 2015;134:63-72.
- [Google Scholar]
- The correlation, relativistic, and vibrational contributions to the dipole moments, polarizabilities, and first and second hyperpolarizabilities of ZnS, CdS, and HgS. J. Chem. Phys.. 1999;111(17):7904-7915.
- [Google Scholar]
- Orbital Interaction Theory of Organic Chemistry (second ed.). New York: John Wiley & Sons; 2001. 2001, 34
- The density functional study of electronic structure, electronic charge density, linear and nonlinear optical properties of single crystal alpha-LiAlTe 2. J. Alloy. Compd.. 2014;592:92-99.
- [Google Scholar]
- A Guide to the Complete Interpretation of Infrared Spectra of Organic Structures. Wiley; 1994.
- Lowdin P., ed. Advances in Quantum Chemistry. Vol vol. 2. New York: Academic Press; 1978.
- Characterization of ZnSe nanoparticles synthesized by microwave heating process. Solid State Commun.. 2009;149(45):2047-2049.
- [Google Scholar]
- Ferroelectricity in glycine picrate: an astonishing observation in a centrosymmetric crystal. Appl. Phys. Lett.. 2009;95(25) p. 252902–252902-3
- [Google Scholar]
- Enhancement of second harmonic generation, optical and dielectric properties in L-asparagine monohydrate single crystals due to an improvement in crystalline perfection by annealing. J. Appl. Crystallogr.. 2010;43(3):491-497.
- [Google Scholar]
- Physico chemical properties of l-asparagine l-tartaric acid single crystals: a new nonlinear optical material. Spectrochim. Acta Part A Mol. Biomol. Spectrosc.. 2014;118:172-176.
- [Google Scholar]
- On the ground and excited state of glycine–glutaric acid: a new organic material. Spectrochim. Acta Part A Mol. Biomol. Spectrosc.. 2014;125:453-457.
- [Google Scholar]
- Optical spectroscopy, crystalline perfection, etching and mechanical studies on P-nitroaniline (PNA) single crystals. Opt. Mater.. 2014;36(3):675-681.
- [Google Scholar]
- Experimental and theoretical studies on bis (glycine) lithium nitrate (BGLiN): a physico-chemical approach. J. Phys. Chem. Solids. 2014;75(8):959-965.
- [Google Scholar]
- First principal studies of spectroscopic (IR and Raman, UV-visible), molecular structure, linear and nonlinear optical properties of L-arginine p-nitrobenzoate monohydrate (LANB): a new non-centrosymmetric material. Spectrochim. Acta Part A Mol. Biomol. Spectrosc.. 2015;147:84-92.
- [Google Scholar]
- A dual approach to study the electro-optical properties of a noncentrosymmetric l-asparagine monohydrate. Spectrochim. Acta Part A Mol. Biomol. Spectrosc.. 2015;137:432-441.
- [Google Scholar]
- A physico-chemical approach to study the experimental and theoretical properties of l-ornithine monohydrochloride: an organic nonlinear optical material. Mater. Chem. Phys.. 2015;155:36-46.
- [Google Scholar]
- Experimental and density functional theory (DFT): a dual approach to study the various important properties of monohydrated L-proline cadmium chloride for nonlinear optical applications. Spectrochim. Acta Part A Mol. Biomol. Spectrosc.. 2015;143:128-135.
- [Google Scholar]
- An investigation on the key features of a D-π-A type novel chalcone derivative for opto-electronic applications. RSC Adv.. 2015;5(106):87320-87332.
- [Google Scholar]
- Molecular structure, heteronuclear resonance assisted hydrogen bond analysis, chemical reactivity and first hyperpolarizability of a novel ethyl-4-{[(2,4-dinitrophenyl)-hydrazono]-ethyl}-3,5-dimethyl-1H-pyrrole-2-carboxylate: a combined DFT and AIM approach. Spectrochim. Acta Part A Mol. Biomol. Spectrosc.. 2012;92:295-304.
- [Google Scholar]
- Harmonic vibrational frequencies: scaling factors for HF, B3LYP, and MP2 methods in combination with correlation consistent basis sets. J. Phys. Chem. A. 2004;108(42):9213-9217.
- [Google Scholar]
- Infrared Spectral Interpretation: A Systematic Approach. CRC Press; 1998.
- Infrared and Raman Characteristic Group Frequencies: Tables and Charts. John Wiley & Sons; 2004.
- Studies on the growth and characterization of l-asparaginium picrate (LASP) a novel nonlinear optical crystal. Cryst. Growth Des.. 2006;6(7):1663-1670.
- [Google Scholar]
- Experimental and CIS, TD-DFT, ab initio calculations of visible spectra and the vibrational frequencies of sulfonyl azide-azoic dyes. Spectrochim. Acta Part A Mol. Biomol. Spectrosc.. 2009;72(2):369-377.
- [Google Scholar]
- Experimental (FT-IR, FT-Raman) and theoretical (HF and DFT) investigation and HOMO and LUMO analysis on the structure of p-fluoronitrobenzene. Spectrochim. Acta Part A Mol. Biomol. Spectrosc.. 2011;83(1):575-586.
- [Google Scholar]
- A theoretical approach to the nucleophilic behavior of benzofused thieno [3, 2-b] furans using DFT and HF based reactivity descriptors. Arkivoc. 2009;7:311-329.
- [Google Scholar]
- Efficient implementation of the gauge-independent atomic orbital method for NMR chemical shift calculations. J. Am. Chem. Soc.. 1990;112(23):8251-8260.
- [Google Scholar]
- Absorption and fluorescence properties of oligothiophene biomarkers from long-range-corrected time-dependent density functional theory. PCCP. 2009;11:4498-4508.
- [Google Scholar]
- A new hybrid exchange–correlation functional using the Coulomb-attenuating method (CAM-B3LYP) Chem. Phys. Lett.. 2004;393:51-57.
- [Google Scholar]
- The M06 suite of density functionals for main group thermochemistry, thermochemical kinetics, noncovalent interactions, excited states, and transition elements: two new functionals and systematic testing of four M06-class functionals and 12 other functionals. Theoret. Chem. Acc.. 2008;120(1–3):215-241.
- [Google Scholar]
- Chirality and hydrogen bonding in molecular crystals for phase-matched second-harmonic generation: N-(4-nitrophenyl)-(L)-prolinol (NPP) J. Chem. Phys.. 1984;81(9):4160-4167.
- [Google Scholar]
Appendix A
Supplementary data
Supplementary data associated with this article can be found, in the online version, at http://dx.doi.org/10.1016/j.jksus.2016.03.002.
Appendix A
Supplementary data


