
Translate this page into:
The Forgotten Art of Plain Radiography in the Evaluation of Metabolic Bone Disease

*Corresponding author: Dr. Jyoti Panwar, Department of Radiology, Christian Medical College and Hospital, Vellore - 632 004, Tamil Nadu, India. drjyoticmch@gmail.com
-
Received: ,
Accepted: ,
How to cite this article: Panwar J, Kandagaddala M, Bhat TA, Hsu C, Mitra P. The Forgotten Art of Plain Radiography in the Evaluation of Metabolic Bone Disease. Indian J Musculoskelet Radiol 2020;2(1):3-19.
Abstract
Although the metabolic bone diseases are fairly commonly encountered in routine practice in India, unfortunately, the clinical presentation is quite non-specific and often remains unrecognized for years, leading to increased morbidity. In this era of advanced imaging technologies, magnetic resonance imaging (MRI) is increasingly being requested by clinicians as an initial investigation for the non-specific presentation of metabolic bone conditions, including back pain, generalized weakness, and arthralgias, and is usually largely non-contributory. Thus, the importance of plain radiographs is neglected. Although basic radiographs are frequently available at the time of MRI, it is often ignored by both the radiologists and clinicians who can lead to misdiagnosis or missed diagnosis. A variety of radiographic findings is encountered in metabolic bone diseases, though often subtle, is unceasingly diagnostic, and recognition of these findings leads to early diagnosis and treatment, resulting in improved patient outcomes. Therefore, the objective of our paper is to present a systematic approach to the interpretation of plain radiographs of the pelvis, spine, and chest that can facilitate identifying subtle imaging findings supported by complementary other region plain radiographs and laboratory data for the evaluation of metabolic bone diseases.
Keywords
Plain radiography
Pelvis
Spine
Chest
Systematic approach
Metabolic bone diseases

INTRODUCTION
Plain radiography is a mainstay in the diagnostic armamentarium for assessing bone diseases.[1] With the ability to better evaluate slight alteration in bone density, subtle bone resorption, new bone formation, and incomplete/insufficiency fracture, plain radiography scores over magnetic resonance imaging (MRI) or computed tomography (CT) for the assessment of metabolic bone conditions.[2]
Patients often present to orthopedic or rheumatology clinics with non-specific back pain, generalized ache, and arthralgia mimicking degenerative diseases of the spine or spondyloarthropathies, and undergoing MRI of spine or sacroiliac (SI) joint or pelvis. Often, they do not have plain radiographs at the time of the initial interpretation of cross-sectional imaging. Even though the baseline radiographs are available at the time of advance imaging evaluation, most of the time, they are overlooked by reporting radiologists and treating physicians and eventually, patients returned to clinics with non-specific MRI/CT reporting without a specific diagnosis. Thus, the initial assessment of plain radiographs and correlating them with MRI/CT is vital to assist in diagnosing metabolic bone diseases. A comprehensive understanding of relevant radiological findings of these conditions is necessary for appropriate early diagnosis and management.
To be seamlessly incorporated into clinical practice, the interpretation of radiographs needs to be approached in the same way every time, just like performing a physical examination or diagnostic scopes. The purpose of this article is to present a systematic approach to interpreting baseline plain radiographs for the evaluation of metabolic bone conditions and also to discuss the imaging features and further appropriate additional imaging and laboratory parameters for the commonly encountered metabolic bone diseases.
SYSTEMATIC APPROACH
A systematic approach to interpreting plain radiographs begins with optimal and consistent radiographic acquisition parameters and positioning (Table 1).[3-7] The systematic approach of any radiograph can be anatomically inside to outside or outside to inside and superior to inferior or inferior to superior. The approach detailed in this article works from inside to outside and superior to inferior. The rationale for this approach is to minimize the chance of missing pathology or of skipping the evaluation of the structures that might have a subtle clue for the diagnosis. Firstly, the entire radiograph should be evaluated for generalized or regional alteration in the bone density (including diffuse osteopenia, osteosclerosis, mixed heterogeneous or dirty or fuzzy bone density and focal lesion) and any gross abnormality in the alignment. Secondly, all the points of the checklist for the particularly given radiograph should be evaluated.
| Radiograph | Parameters | Pitfalls |
|---|---|---|
| Skull: Lateral radiograph | Film size: 10 × 12 in (24 × 30 cm), horizontal orientation. Patient position: Semi-prone Part position: Head is in a true lateral position against the bucky. e infraorbital-meatal line is parallel with the long edge of the cassette, and the interpupillary line is perpendicular. CR: Passes 3/4 in superior and 3/4 in anterior to the external auditory meatus. Collimation: To skull size. |
Artifacts: Removal of head/hair jewelry wherever possible. Tight hair braids and tie bands also can produce confusing artifacts. |
| Lumbar spine: AP projection | Film size: 14 × 17 in (35 × 43 cm), vertical orientation. Patient position: Upright or supine. e use of a footplate to standardize feet position and equal weight distribution is a useful adjunct. CR: 1.5 in below the iliac crest level. Center film to the CR. Collimation: 14 × 17 in (35 × 43 cm) field. |
Incomplete inclusion of the pelvis: Whenever possible include the iliac crests, ischia, and proximal femurs. Exclusion of the thoracolumbar junction: By including the lower pelvis fewer vertebrae and lower ribs will be includedin the exposure field, which are often implicated in back pain syndromes. Lordosis artifact: e intervertebral disc spaces and endplates will be obscured away from L3 because of the lordosis effect. Foot position: e feet should be equidistant from the midline and separated to lie in line with the femoral heads with equal weight distribution. Large patients: Upright films are significantly reduced in quality in large patients; supine views are preferred to compress the abdomen and reduce the time of exposure. |
| Lumbar spine: Lateral radiograph | Film size: 7 × 17 in (18 × 43 cm) or 14 × 17 in (35 × 43 cm), if lordosis is increased, with obesity. Patient position: Upright lateral or lateral recumbent. CR: One inch above the iliac crest level, with the vertical CR passing halfway between the anterior superior iliac spine and posterior superior iliac spine. Center film to the CR. Collimation: Top and bottom of film, side collimation to accommodate the lordosis. Breathing instructions: Suspended expiration (elevates diaphragm to show lower thoracic spine). |
Pitfalls in AP radiographview and besides: Uneven exposure: e lower thoracic vertebrae are often overexposed because the lung base and the lumbosacral junction are underexposed because of the overlapping pelvis. Balancing filtration and suspended expiration can be used to minimize this effect. Patients with a large difference in the pelvis and waist (>5 cm) may require a separate exposure for L5–S1 and T12–L4. Spinous processes are usually overexposed and may require specific underexposed study for adequate demonstration. |
| Pelvis | Film size: 14 × 17 in (35 × 43 cm), horizontal orientation. Patient position: Supine or upright. Part position: Center the mid-sagittal plane of the body to the midline. Internally rotate the feet about 15° (heels apart and big toes together), and use sandbags to stabilize. CR: Midway between the symphysis pubis and iliac crest. Center film to the CR. |
Limb rotation: If the feet are not internally rotated, the femoral necks will appear foreshortened and their anatomic details and relationships will be obscured. |
| Hand posteroanterior projection |
Film size: 8 × 10 in (18 × 24 cm), vertical orientation. Grid: No. Patient position: Seated. Apply lead half apron for gonad protection. Part position: Hand is placed palm down on the film with the fingers extended. CR: Third metacarpal head. Collimation: To hand size. |
Joint flexion pseudo-fusion artifact: Failure to straighten the digits at the time of exposure will prevent clear definition of the joint spaces. Wrist flexion-extension: The wrist should be flat onto the cassette, otherwise the carpal bones and their joints will be distorted. |
| Chest posteroanterior projection | Film size: 14 ×17 in (35 × 43cm), horizontal orientation. Grid: Yes. kVp: 120 to 150 Patient position: Standing and in full inspiration, facing the upright image receptor Part position: The top of the lungs should be visible. The exposure should be made at full inspiration and should show rib 10 posteriorly above the diaphragm and rib 6 anteriorly. Both costophrenic angles and the lower parts of the diaphragm should be visible. The lungs and spine should be visible behind the heart shadow. CR: The level of the 7th thoracic vertebra Collimation: Superiorly 5 cm above the shoulder joint to allow proper visualization of the upper airways, inferior to the inferior border of the 12th rib, and lateral to the level of the acromioclavicular joints |
Labeling of side marker: To avoid a diagnosis of dextrocardia or situs inversus due to mislabeling. Rotation: May cause a spurious increase in cardiac size and increased opacification at the lung bases because of the overlying soft tissues. Artifacts: Common artifacts include ECG stickers, the patient’s hair and clothing, and hospital bedding. |
CR: Central ray
Before proceeding to details of the imaging approach of different region radiographs, let us learn how to decide about the diffuse or regional decrease and increase in bone density on the plain radiographs. Osteopenia or a decrease in bone density is one of the most common findings in skeletal radiology.[8,9] Radiography is not a sensitive modality, as at least 30% bone loss is required to appreciate osteopenia on a radiograph.[8,10-12] Another drawback with plain radiographs is subjective assessment meaning lack of some standard by which to compare the area of interest. Finally, differences in radiographic technique can widely alter the radiologist’s perception of whether or not osteopenia is present. However, when it is present, it can be appreciated as a regional or generalized increased radiolucency of the bone, decreased cortical thickness, and loss of bony trabeculae in the early stages on plain radiograph,[9,13] as shown in Figure 1. Bones such as the vertebra, ends of long and tubular bones (proximal femur, proximal tibia, distal radius, and hand, especially metacarpals), and calcaneum are usually looked at for the evidence of osteopenia.[14-17] The most common cause by far of osteopenia is osteoporosis.[14-17] However, many disease entities can cause osteopenia and its presence prompts a search for other more specific radiographic clues to the exact underlying metabolic disorder, as described in Table 2. There are non-metabolic conditions that can present with a decrease in bone density and should be differentiated from metabolic disorders, as described in Table 3.[10,18,19,20,21,22,23]

- Osteopenia. Cortical thinning (circle), loss of trabeculae leading to increased radiolucency (star) on the frontal radiograph of the knee (b) as compared to normal radiographic appearance (a). Note the subtle subperiosteal resorption (arrows in b) along the medial cortex of upper tibia is a clue for underlying condition (primary hyperparathyroidism). Multilevel lumbar spine cortical thinning and accentuated vertical trabeculae due to the rarefaction of horizontal trabeculae result in “picture framing” appearance on the lateral view of the lumbar spine (d), more clearly appreciated when compared with a normal lumbar spine radiograph (c). Osteoporotic compression fracture of an L1 vertebral body with greater than 50% height loss (d). Similar cortical thinning and loss of trabeculae in tubular bones (metacarpals in f) as compared to normal (e). Corticomedullary index (e): Semi-quantitative measure for grading osteoporosis in the hand: The cortical thickness (red lines) compared with the whole thickness of metacarpal (blue line). The cortical thickness <25% of the metacarpal thickness signifies osteoporosis (normally 25–33%).
| Systematic evaluation of pelvis, spine, and chest radiographs in metabolic bone diseases | |||
|---|---|---|---|
| ¯ Additional clues from the hand, knee and lateral skull radiographs Decreased bone density |
|||
| Findings | Diagnosis | What next? Laboratory values |
Further imaging |
| 1. Diffuse osteopenia 2. Resorption – subperiosteal/subchondral/trabecular/subligamentous/subtendinous/intracortical 3. Brown tumors 4. Chondrocalcinosis |
Primary hyperparathyroidism | 1. Elevated serum calcium 2. Normal phosphorous 3. Elevated parathormone levels |
1. Ultrasound neck to assess parathyroid lesions. 2. Scintigraphy or 4D-CT to localize the parathyroid adenoma |
| 1. Dense metaphyseal bands 2. Skull vault thickening 3. Intracranial calcification 4. Soft-tissue calcification |
Hypoparathyroidism | 1. Low serum calcium 2. Raised phosphorous 3. Low parathyroid hormone levels. |
CT brain to assess intracranial calcifications |
| 1. Brachydactyly – short metacarpals (inclusive of short 4th/5thmetacarpals/short metatarsals 2.Soft-tissuecalcification 3. Short metaphyseal or broad bones with coned epiphyses |
Pseudo-hypoparathyroidism | 1. Low serum calcium 2. Raised phosphorous 3. Raised parathyroid hormone levels |
|
| 1. Brachydactyly – short metacarpals (inclusive of short 4th/5thmetacarpals/short metatarsals 2. Soft-tissue calcification 3. Short metaphyseal or broad bones with coned epiphyses |
Pseudo-pseudo-hypoparathyroidism | 1. Normal serum calcium 2. Raised phosphorous 3. Normal parathyroid hormone levels |
|
| 1. Diffuse osteopenia 2. inning of the cortices 3. Loss of trabeculae 4. Vertebral collapse/compression fractures |
Osteoporosis | Serum, calcium, phosphorous | Bone mineral density |
| 1. Fuzzy or dirty appearance of bone density 2. Pseudo-fractures in pelvis, scapula, and ribs 3. Decreased vertebral body height 4. Bowing of long bones 5. Protrusio acetabula |
Osteomalacia | 1. Normal serum calcium 2. Low phosphorous 3. Raised parathyroid hormone levels |
|
| 1. Pseudo-fractures in pelvis, scapula, and ribs 2. Decreased vertebral body height 3. Bowing of long bones |
Tumor-induced osteomalacia | 1. Normal serum calcium 2. Low phosphorous 3. Raised fibroblast growth factor (FGF-23) |
Ga-67 DOTA PET scan of the whole body to localize themesenchymal lesions |
| 1. Widening of physis 2. Irregularity and splaying of bone at the junction of metaphysis and physis 3. Bowing of long bones 4. Rachitic rosary of ribs |
Rickets | 1. Normal or low serum calcium 2. Normal or low phosphorous 3. Raised parathyroid hormone levels |
|
| 1. Widening of physis 2. Irregularity and splaying of bone at the junction of metaphysis and physis 3. Bowing of long bones 4. Rachitic rosary of ribs |
Hypophosphatemic rickets/Vitamin D resistant rickets | 1. Normal serum calcium 2. Low phosphorous 3. Normal or raised parathyroid hormone levels 4. Normal Vitamin D |
|
| Stress fracture with pronounced enthesopathy changes | X-linked hypophosphatemia | ||
| 1. Osteopenia. 2. Periosteal reaction related to subperiosteal hemorrhage 3. Dense zone of provisional calcification 4. Lucent metaphyseal band (Trummerfield zone) |
Scurvy | Low Vitamin C | |
| 1. Severe osteoporosis 2. Multilevel intervertebral disc calcification and disc space narrowing 3. Early marked osteoarthritic changes |
Alkaptonuria | Homogentisic acid in the urine | |
| 1. Skull or cervical spine – basilar invagination/Wormian bones/loss of lamina dura 2. Chest – pectus excavatum 3. Pelvis – protrusio acetabuli, coxa vara 4. Long bones – deformed, gracile bones with fractures |
Osteogenesis imperfecta | Genetic analysis – mutations in the COL1A1 and COL1A2 genes | |
| Category | Conditions | Clinicoradiological diagnostic clues |
|---|---|---|
| Vascular | Anemic sates | 1. Diffuse osteopenia with features of marrow expansion 2. Additional radiographic findings such as bone infarcts, osteonecrosis, and osteoporotic fractures depending on the underlying cause |
| Drugs/dietary deficiency | Drugs – steroid, heparin dietary deficiency (Vitamin C and D and calcium deficiency) |
Diffuse osteopenia with fractures (vertebral fractures) |
| Neoplastic | Osteolytic metastases | 1. May have a known history of cancer. 2. Focal lytic lesions with or without diffuse osteopenia. |
| Multiple myelomas | 1. Diffuse osteopenia disproportionate to the age 2. Osteoporotic vertebral fractures 3. Small, lytic, punched-out, round lesions within the skull, spine,pelvis, and long bones (subtle lesions can be detected by the appearance of endosteal scalloping – slight undulation to the inner cortical margin of bone) |
|
| Toxic/poisoning | Alcoholism Chronic liver disease. |
Diffuse osteopenia with fractures |
| Congenital | Osteogenesis imperfecta | 1. Severe generalized osteopenia with pencil-thin cortices 2. Multiple fractures, especially lower extremities 3. Biconcave lens vertebrae |
| Massive osteolysis of Gorham | Dramatic bone destruction with pathologic fractures. | |
| Idiopathic osteoporosis | Diffuse osteopenia with fractures | |
| Senile and postmenopausal osteoporosis | 1. Most common causes of generalized osteoporosis 2. Diffuse osteopenia with fractures |
|
| Regional osteoporosis | Immobilization and disuse Reflex sympathetic dystrophy syndrome Transient regional osteoporosis |
Similarly, osteosclerosis or increase in bone density can be a manifestation of many metabolic bone or systemic disorders. It may predominantly affect the medullary cavity and/or cortex of the bone. It is seen as a localized or generalized increase in the radiodensity of bone, trabecular, and cortical thickening and often loss of corticomedullary differentiation on plain radiograph,[24-26] as shown in [Figure 2]. The most common cause by far of osteosclerosis is secondary hyperparathyroidism seen in renal osteodystrophy.[17] However, many metabolic disease entities can cause an increase in bone density and its presence prompts a search for other more specific radiographic clues to the exact underlying disorder, as described in Table 4. Increased bone density can also be associated with conditions other than metabolic bone diseases (Table 5) and need to be differentiated from metabolic disorders.[21-23,27]
- Osteosclerosis. Cortical and trabecular thickening leading to foci of increased radiodensity on the frontal radiograph of the pelvis (a) and homogenous diffuse increase in bone density leading to loss of corticomedullary differentiation; however, bone architecture is maintained (c) as compared to normal appearance (b). Note the subtle incomplete fracture along the medial cortex of the upper femur bilaterally (arrows in a) in case of secondary hyperparathyroidism due to renal osteodystrophy and multilevel osteophytosis (short arrows), and sacrospinous ligament ossification (long arrows) (c) in a proven case of fluorosis.
| Systematic evaluation of pelvis, spine, and chest radiographs in metabolic bone diseases | |||
|---|---|---|---|
| ¯ Additional clues from the hand, knee and lateral skull radiographs Increased bone density |
|||
| Findings | Diagnosis | What next? | |
| Laboratory values | Further imaging | ||
| 1. Diffuse osteosclerosis 2. Biconcave vertebral bodies, with insufficiency fractures 3. Rugger-Jersey spine 4. Bone resorption 5. Brown tumors 6. Soft tissue and vascular calcifications |
Renal osteodystrophy | 1. Elevated serum calcium and normal phosphorus 2. Normal parathormone level |
Ultrasound kidneys |
| 1. Diffuse osteosclerosis 2. Ossification of the attachments of tendons, ligaments, and muscles 3. Interosseous membrane ossification 4. Ossification of the posterior longitudinal ligament 5. Periosteal bone formation |
Fluorosis | Elevated serum and water fluoride levels | Orthopantomogram for a dental evaluation. |
| 1. Heel pad thickness > 20 mm 2. Skull: Sella turcica enlargement, sinus overgrowth, and malocclusion 3. Hand and feet: Widened shafts, bony protuberances, enlarged distal tufts (spade like), and widened joint spaces 4. Spine: Platyspondyly, hyperostoses, widened disc and facet spaces, posterior body scalloping, and widened atlanto-dental space |
Acromegaly | Elevated basal growth hormone and insulin-like growth factor-1 levels | MRI brain with gadolinium – a pituitary protocol to assess pituitary adenoma. |
| 1. Well-defined radiolucent lesion with ground-glass matrix with thick peripheral sclerotic rim (rind sign). No periosteal reaction 2. Commonly oriented along the long axis of the bone 3. Solitary or multiple 4. Craniofacial fibrous dysplasia – typically demonstrates dense sclerotic lesions |
Fibrous dysplasia | Normal metabolic profile | To assess other lesions or syndromic workup. |
| 1. Skull – diploic widening, cotton wool appearance, and osteoporosis circumscripta 2. Spine – picture frame vertebra, cortical, and trabecular thickening 3. Pelvis – cortical, trabecular, iliopectineal, and ilioischial line thickening 4. Long bones – bowing deformities and blade of grass appearance |
Paget’s disease | 1. Normal calcium and phosphorous levels 2. Elevated serum alkaline phosphatase |
Regular monitoring to assess complications such asfractures and sarcomatous transformation. |
| Category | Conditions | Clinicoradiological diagnostic clues |
|---|---|---|
| Hematological disorders | Myelofibrosis | 1. Hepatosplenomegaly and splenic infarcts 2. Anemia and extramedullary hematopoiesis (posterior mediastinal or paravertebral soft tissuemasses and lymphadenopathy) 3. Diffuse osteosclerosis without bony architectural distortion most commonly involving axial skeleton, ribs, proximal humerus, and femur |
| Sickle cell disease | 1. Anemia (bone marrow expansion resulting in the classic “hair on end appearance” in the skull, rib expansion) with extramedullary hematopoiesis 2. Recurrent veno-occlusive crisis dactylitis (periosteal reaction along the metacarpals/metatarsals and phalanges), H-shaped vertebrae, bone infarcts, and avascular necrosis/osteonecrosis giving irregular foci of increased bone density 3. Osteomyelitis most commonly affects the diaphyses of the femur, tibia, or humerus (whereas the metaphyseal location is more common in the non-sickle population), septic arthritis 4. Gout arthropathy |
|
| Sclerotic multiple myeloma | 1. Uncommon (3% of myeloma cases) 2. Diffuse osteosclerosis/multiple sclerotic lesions 3. May be associated with POEMS syndrome – clinicoradiological features of polyneuropathy, organomegaly, endocrinopathy, monoclonal gammopathy, and skin changes |
|
| Neoplastic | Sclerotic metastases | 1. May have a known history of cancer (e.g., breast, prostate, gastric, and neuroendocrine) 2. Focal sclerotic lesions or diffuse sclerosis which has an irregular appearance |
| Lymphoma | 1. Focal multifocal sclerotic lesions or diffuse irregular patchy sclerosis with maintained bone architecture 2. Extraosseous soft tissue, lymphadenopathy |
|
| Leukemia | 1. Diffuse process (more common) focal/multifocal lesion. | |
| Mastocytosis | 1. Variable appearances – either lytic, sclerotic or mixed, diffuse (more common), or focal. 2. Hepatosplenomegaly, lymphadenopathy, diffuse small bowel wall thickening 3. Clinical history is often helpful: Urticaria pigmentosa, symptoms, and signs of carcinoid syndrome-like hypotension and syncope, abdominal pain, nausea, vomiting, and diarrhea malabsorption |
|
| Toxic/poisoning | Fluorosis | 1. Diffuse osteosclerosis 2. Ossification of the attachments of tendons, ligaments, and muscles, ossification of the posterior longitudinal ligament and interosseous membrane 3. Multilevel osteophytosis and periosteal bone formation 4. Elevated serum and water fluoride levels |
| Hypervitaminosis D | 1. Very rare and is usually secondary to large doses of Vitamin D over long periods 2. Nephrocalcinosis, peptic ulcer disease, and pancreatitis 3. Diffuse osteosclerosis 4. Alternating bands of decreased and increased density in the metaphyses, best seen at the wrist with metaphyseal widening 5. ickened cortices of metacarpals, metatarsals, and phalanges 6. Periarticular calcifications 7. Increased level of serum Vitamin A and calcium |
|
| Hypervitaminosis A | 1. Pseudotumor cerebri in acute and pruritus, dry skin, dry lips in chronic toxicity 2. Premature fusion of ossification centers 3. Widened cranial sutures 4. Hepatosplenomegaly 5. Tendinous/ligamentous calcifications 6. Diffuse symmetric periostitis (scintigraphy may allow earlier detection) 7. Increased level of serum Vitamin A |
|
| Lead | 1. Variable neurological and gastrointestinal symptoms 2. Blue-black line in gum and anemia 3.Dense metaphyseal bands, particularly at the distal ulna and proximal fibula (here the growth is not as great as other long bones); growing bones may be dense normally |
|
| 4. Bone-in-bone appearance 5. Erlenmeyer flask appearance to the distal femur. |
||
| Sclerosing bone dysplasia | Melorheostosis | Streaked or wavy periosteal new bone; wax flowing down a lighted candle appearance, usually monomelic |
| Osteopoikilosis | Multiple small rounded/oval symmetric meta-epiphyseal sclerotic foci | |
| Osteopathia striata | Vertical metaphyseal striations of increased density | |
| Skeletal dysplasias | Osteopetrosis | 1. Hepatosplenomegaly, anemia, and extramedullary hematopoiesis 2. Generalized sclerosis 3. Bone within a bone of entire skeleton; sandwich vertebrae: One of the classical appearances of autosomal dominant osteopetrosis 4. Erlenmeyer flask deformity of the tubular bones 5. Multiple fractures with exuberant callus formation 6. ickened sclerotic skull vault with multiple cranial nerve compression |
| Pyknodysostosis | 1. Short stature, short stubby fingers, long bone fractures 2. Diffuse osteosclerosis 3. Acro-osteolysis 4. Obtuse mandibular angle 5. Calvarial thickening, delayed sutural closure, Wormian bones 6. Abnormal dentition 7. Hypoplastic clavicles |
|
| Tuberous sclerosis | 1. Intracranial calcification 2. Hyperostosis of cranium 3. Periosteal new bone (warts) in tubular bones, coarsened trabeculae; osteoblastic deposits in spine and pelvis |
|
| Chronic recurrent multifocal osteomyelitis (CRMO) | 1. Typically seen in children or young adults 2. Clavicle involvement is characteristic 3. Variable appearances – purely osteolytic, mixed lytic and sclerotic, and purely sclerotic 4. Associated with psoriasis, inflammatory bowel disease, or skin conditions, including SAPHOsyndrome |
|
| Idiopathic | Caffey disease (infantile cortical hyperostosis) | 1. Triad of irritability, swelling, and osseous lesions 2. Most commonly affect flat bones, mandible being the commonest location 2. Dense laminated subperiosteal new bone formation 3. A marked increase in cortical width and density |
There is an another term called “fuzzy” or “heterogeneous” or “dirty” bone density often seen in patients with rickets and osteomalacia. It manifests as a coarse trabecular demineralization with an amorphous ground-glass appearance and ill-defined cortical margins,[2,28,29] as shown in [Figure 3]. The presence of large quantities of unmineralized osteoid can give intermediate density to the trabecular bone with the indistinct cortex and trabeculae may give the impression of a “poor-quality” radiograph.[16]

- Fuzzy/heterogeneous/dirty bone density. A slight diffuse decrease in bone density with an indistinct trabecular pattern and erased cortical margin (thin white arrows) giving an amorphous ground-glass appearance on the pelvic radiograph (b) as compared to normal radiograph (a). Note the subtle pseudo-fractures along the superior pubic rami (thick white arrows) and widened proximal femoral physis (black arrows) with slight medial displacement of epiphysis (b) due to rickets.
I. Approach to chest radiograph: A systematic interpretation of chest radiograph should be done for the following checklist when evaluating for metabolic bone disease. The checklist consists of following areas for the evaluation:
Distal clavicle [Figure 4]: The lateral end of the clavicle should be evaluated for the presence of erosion/ irregularity for the underlying subchondral resorption at the clavicular side of the acromioclavicular joint which may lead to pseudo-widening of the joint. In most of these cases, acromion is normal. Similar subtle cortical erosion/irregularity can be seen along the inferior aspect of the outer third of the clavicle at the site of costoclavicular ligament resorption due to underlying subligamentous attachment.
Scapula [Figure 4]: The axillary border of the scapula should be checked for the presence of incomplete transversely oriented lucency suggests Looser’s zone or pseudo-fracture or insufficiency fracture.
Proximal humerus [Figures 4 and 5]: The proximal humerus should be carefully seen for the presence of subtle periosteal cortical irregularity along the medial aspect of the upper humerus for the underlying subperiosteal resorption, physeal widening, and metaphyseal changes of rickets and subchondral insufficiency fracture of the humeral head.
Ribs [Figure 5]: Ribs should be assessed for the increased lucency and indistinctness of cortices of the ribs, particularly of the posterior ribs in the midclavicular line due to subperiosteal resorption. In addition, ribs should be checked for the presence of insufficiency fracture which can be seen as a lucency or sclerosis involving the ribs and can lead to chest wall deformity. The first rib should be checked for the presence of insufficiency fracture.
Vertebrae: After windowing, the imaged thoracic vertebrae should be evaluated for the vertebral body height, obvious fracture line, or focal lesion.
Soft-tissue calcification [Figure 4]: Periarticular region and other soft tissue should be evaluated for the presence of calcification, which can be seen in primary or secondary hyperparathyroidism.
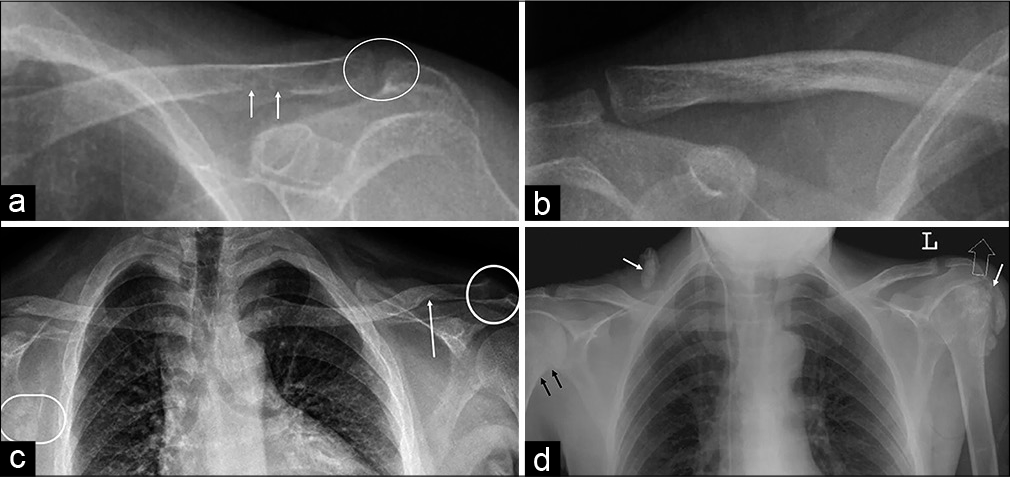
- (a) A 37-year-old female and (c) a 33-year-old male with primary hyperparathyroidism: Subchondral resorption of the distal clavicle (circles), subtle findings of minimal irregularity, and indistinct margin of lateral clavicle (a) are better appreciated when compared to a normal radiograph (b); subligamentous resorption along the inferior clavicle at the site of attachment of coracoclavicular ligament (arrows) as compared to normal (b) and subtle Looser’s zone or pseudo-fracture along the axillary border of right scapula (circle in c). (d) A 35-year-old male with secondary hyperparathyroidism (renal osteodystrophy): Minimal cortical irregularity along the medial cortex of the right upper humerus (black arrows) suggests subperiosteal resorption, soft tissue, and periarticular calcifications (white arrows).
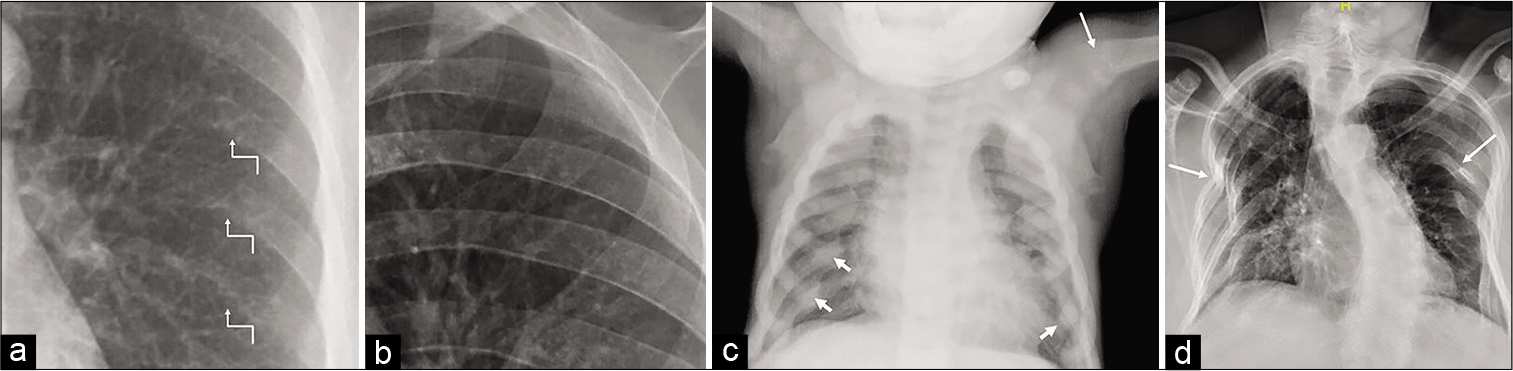
- (a) A 37-year-old female with primary hyperparathyroidism: Subperiosteal resorption along the inferior margin of posterior ribs (arrows in a) in the form of loss of cortical definition well appreciated when compared with a normal radiograph (b) of the same age and sex. (c) A 4-year-old male child with renal rickets: The diffuse increase in bone density with enlarged costochondral junction due to expansion of anterior rib ends (“rachitic rosary”) (short arrows); flared and frayed proximal humeral metaphysis (long arrow). (d) A 42-year-old female with osteomalacia: Multiple insufficiency fractures of ribs, leading to chest wall deformity (arrows). Note the significant scoliotic deformity of the spine due to bone softening.
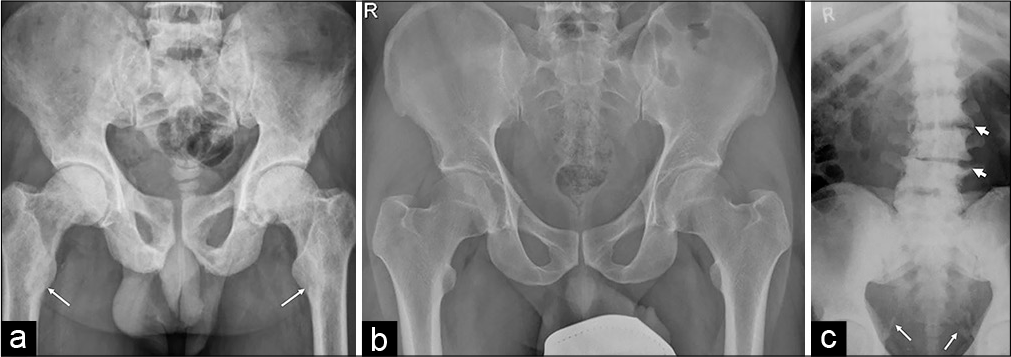
II. Approach to pelvic radiograph: Pelvic radiograph should also be evaluated systematically for the following checklist when evaluating for the metabolic bone disorder:
Visualized lower lumbar vertebrae [Figure 6]: The imaged vertebrae should be looked for any lucency or sclerosis, fracture along the endplates, decrease in the vertebral body height, and focal lesion.
Sacrum [Figure 6]: Sacrum should be checked for the sacral insufficiency fracture, focal lesion, and pagetic changes. Sacral insufficiency fracture is usually seen as a sclerotic or lucent line oriented vertically through the sacral ala, paralleling the SI joint, often with a transverse component – this pattern resembles the letter H, leading to the designation H sign (or Honda sign) seen characteristically on nuclear medicine study.
SI joint [Figure 6]: SI joint should be assessed for erosion and cortical irregularity along the iliac side of the SI joint, leading to the widening of joint space due to underlying subchondral resorption.
Iliac bone including crest and spines [Figures 6 and 7]: These structures are evaluated for the vertical fracture of the medial iliac bone paralleling the SI joint, oblique fracture of the iliac wing oriented somewhat parallel to the iliac crest, subperiosteal bone resorption, and new bone formation and enthesopathy changes at the iliac crest and spines.
Acetabular and periacetabular region [Figure 7]: These regions should be checked for the supra- acetabular insufficiency fracture and periacetabular new bone formation.
Pubic rami [Figures 6 and 7]: Superior and inferior pubic rami should be assessed for the insufficiency fractures. Nearly 90% of fractures at this site occur in conjunction with insufficiency fractures elsewhere within the pelvis.[28]
Iliopectineal and ilioischial lines [Figure 8]: Thickening of iliopectineal and ilioischial lines are the early radiographic features of Paget’s disease and should be evaluated routinely when interpreting pelvic radiograph.
Symphysis pubis [Figures 7 and 8]: It should be assessed for the parasymphyseal insufficiency fracture and subchondral resorption seen as cortical irregularity and erosion at the synchondrosis, leading to widening of synchondrosis.
Ischial tuberosity [Figures 7 and 8]: It should be evaluated for the subtendinous resorption and enthesopathy changes.
The femoral head-and-neck region [Figure 6]: Femoral head and neck should be checked for subchondral/transcervical/medial or lateral femoral neck insufficiency fracture, slipped capital femoral epiphysis, and coxa vara deformity.
Trochanters [Figures 7 and 9]: Both the greater and lesser trochanters should be assessed for the insufficiency fracture and enthesopathy changes.
Imaged upper femoral metadiaphysis [Figures 8-10]: This region should be evaluated for subperiosteal, endosteal, and intracortical resorption, atypical femoral fracture along the lateral femoral cortex, and incomplete fracture line through the medial cortex of proximal metadiaphysis.
All the bones of the pelvis, including imaged upper femur, should be checked for focal lytic lesion [Figure 8], bowing, and bone deformity [Figure 10].

- (a) A 42-year-old male with oncogenic osteomalacia: Frontal pelvic radiograph shows generalized osteopenia and multiple pelvic insufficiency fractures seen as subtle vertical lucent line in the right lateral sacrum paralleling the SI joint (short white arrows) – sacral insufficiency fracture; vertical obliquely oriented lucency in the medial ilium (long white arrows) – medial iliac insufficiency fracture; right superior pubic ramus (thick black arrow); and subchondral left femoral head (thin black arrows) insufficiency fractures. (b) A 37-year-old female with primary hyperparathyroidism: Fuzzy overall radiographic density with decrease height of the L5 vertebra with biconcavity, widened SI joint (double headed arrow), and irregularity of the iliac cortical joint line, suggesting subchondral resorption. (c) A 51-year-old male with Paget’s disease: Mild expansion of the sacrum with coarsened trabeculae, cortical thickening, and sclerosis causing thickening of arcuate lines (arrows).

- (a) A 15-year-old female with primary hyperparathyroidism: Frontal pelvic radiograph shows fuzzy bone density with subperiosteal resorption in the form of periosteal cortical irregularity and scalloped appearances along the outer surface of ilium (long white arrows); subchondral resorption leading to widened symphysis pubis synchondrosis and irregular surface (thick black arrow) and widening of SI joint (star); superior pubic rami pseudo-fractures (short white arrows); widened proximal femoral physis (thin black arrow) with subtle medial displacement of epiphysis suggests bone softening. (b) A 40-year- old male with X-linked hypophosphatemic osteomalacia: Frontal pelvic radiograph depicts flared iliac wings; sclerosis about the SI joints (circle) without erosive changes or ankylosis suggests ligamentous calcification and ossification; prominent ossification suggests enthesopathic changes along anterior iliac spines (white long arrows); periarticular ossification about the acetabular and proximal femoral margins, along the trochanters (short white arrows) and ischial tuberosity (black arrows) at the ligament, joint capsule, and tendon attachment; and subtle bowing of the proximal femoral diaphysis bilaterally. Insufficiency fracture of the mid medial femoral diaphysis (not shown here) was noted in the same patient.

- (a) A 62-year-old female with Paget’s disease: Frontal pelvic radiograph shows multifocal bone expansion, cortical, and trabecular thickening involving sacrum, left hemipelvis and right femur with markedly thickened left iliopectineal (white arrows) and ilioischial (black arrows) lines. (b) A 27-year-old female with primary hyperparathyroidism: Frontal pelvic radiograph shows mild diffuse osteopenia; mild irregularity along the iliac side of inferior part of SI joints and along the symphysis pubis synchondrosis (circle) suggests subtle subchondral resorption; subperiosteal resorption along the medial cortex of the proximal femur bilaterally (black arrows); and multiple lytic lesions (white arrows) suggest brown tumors in the pelvic bones and left femur. (c) A 29-year-old female with primary hyperparathyroidism: Frontal pelvic radiograph shows subtendinous bone resorption at the hamstring origins (circles) on the ischial tuberosity.
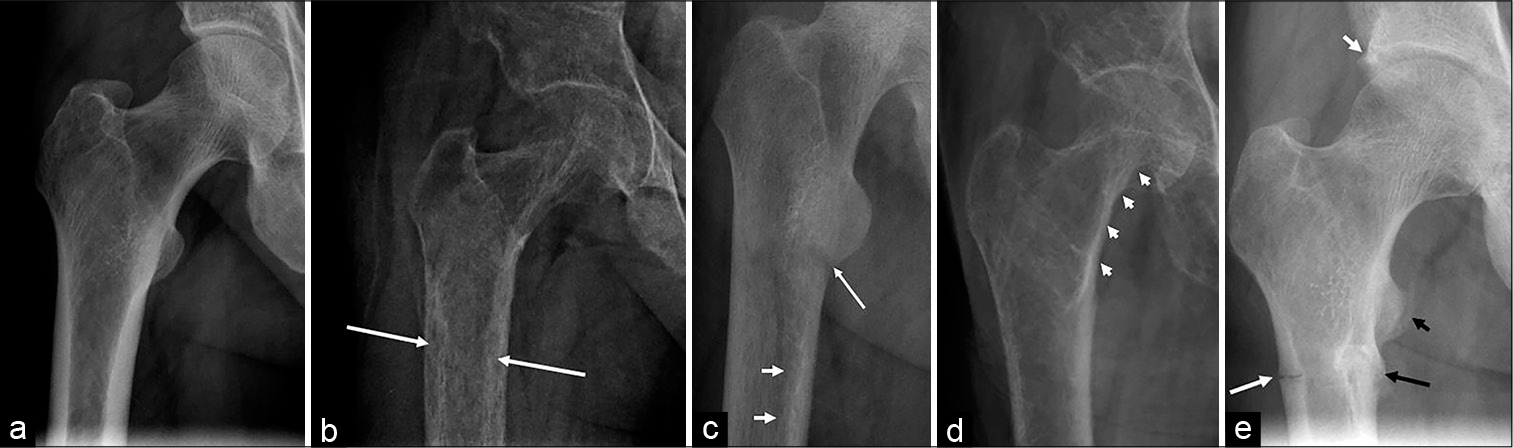
- (a) Normal frontal radiograph of the right proximal femur in a 38-year-old male for comparison. (b) A 33-year-old male with primary hyperparathyroidism: Frontal radiograph of the proximal femur radiograph shows marked osteopenia and tunnel-shaped radiolucency within the cortex (arrows) suggests intracortical resorption clearly evident when compared with the normal cortex in (a). (c) A 27-year-old male with primary hyperparathyroidism: Frontal radiograph of the femur shows diffuse demineralization giving a dirty appearance to bone; a transverse lucency along the medial cortex (long arrow) suggests pseudo-fracture and subtle scalloped defects along the inner margin of the cortex (short arrows) denote endosteal resorption, clearly appreciated when compared with a smooth line of normal endosteal cortex in (a). (d) A 52-year-old female with primary hyperparathyroidism: Frontal radiograph demonstrates diffuse osteopenia with prominent trabeculae; irregularity and scalloping along the periosteal cortex on the medial aspect of neck and proximal shaft of femur (arrows) suggests subperiosteal resorption. (e) A 42-year-old male with X-linked hypophosphatemic osteomalacia: Frontal radiograph of the proximal femur depicts prominent ossification about the acetabulum (short white arrow) and lesser trochanter (short black arrow) at the joint capsule/labral and tendon attachment, respectively; insufficiency fracture along the lateral (long white arrow) and medial (long black arrow) cortices of the subtrochanteric femur; note the callus formation along the medial cortical fracture suggests some healing.
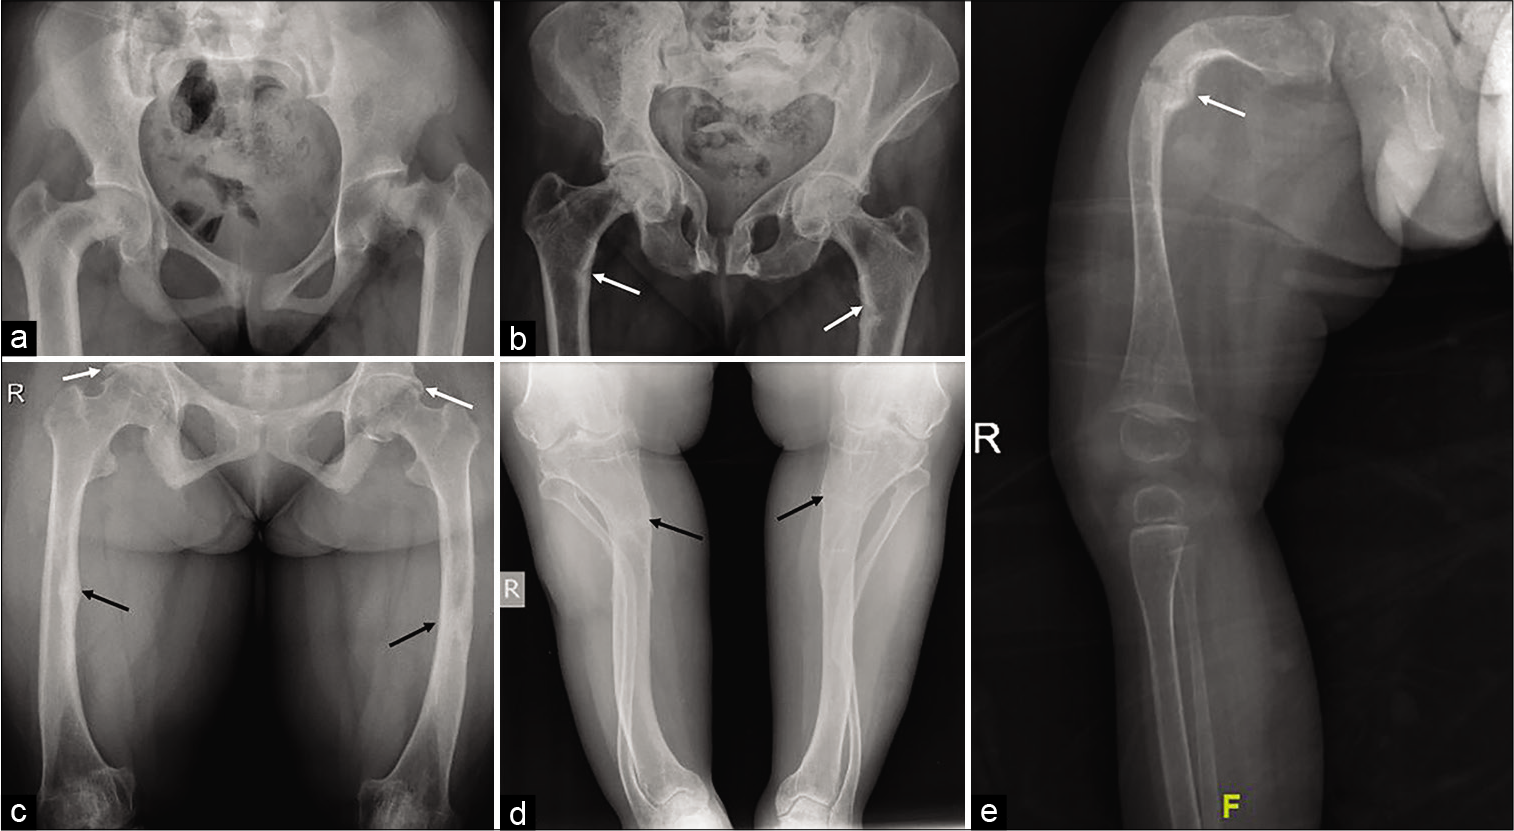
- (a) A 13-year-old girl with primary hyperparathyroidism: Frontal pelvic radiograph shows marked coxa vara deformity of the proximal femur with medial displacement of the epiphysis. Note the widened SI joints and symphysis pubis due to subchondral bone resorption. (b) A 42-year-old female with osteomalacia: Frontal pelvic radiograph shows triradiate deformity of the pelvis with a deformed femoral head sitting deep in the acetabular cup suggests coxa profunda, these characteristic changes are noted due to marked softening of the bone; pseudo- fractures of medial cortex of proximal femoral shaft (arrows). (c-d) A 40-year-old male with X-linked hypophosphatemic osteomalacia: Frontal radiographs of the thigh and leg show bowing of the femora, tibiae, and fibulae with healing fractures (black arrows); trapezoidal distal femoral condyles and proximal tibia, and periarticular ossification about the acetabula and proximal femora (white arrows). (e) A 19-month-old baby with osteogenesis imperfecta: Frontal radiograph of the right leg shows gracile long bones with cortical thinning and trabecular rarefaction; deformed femur with fracture and hyperplastic callus formation (arrow). Note the associated soft-tissue atrophy.
III. Approach to thoracolumbar spine radiograph: Lateral radiograph of the thoracolumbar spine should be assessed for the following checklist areas when evaluating for the metabolic bone disorder:
Thinning of cortices and prominent vertical trabeculae [Figures 1 and 11]: This is a non-specific finding of osteopenia that could be due to osteoporosis or other underlying metabolic or neoplastic conditions.
Vertebral compression fracture and vertebra plana [Figure 1]: Lateral radiograph of the spine should be looked for the presence of a varying degree of compression fracture of vertebrae, especially lucency or sclerosis, paralleling the superior or less commonly inferior endplate and can be seen in insufficiency/stress fracture.
Decrease height of the vertebrae with biconcave endplates [Figure 11]: This finding along with osteopenia or fuzzy bone density suggests bone softening and commonly seen in patients with osteomalacia.
Rugger-Jersey spine [Figure 11]: Lateral radiograph should be checked for sclerosis adjacent to the endplates seen in patients with renal osteodystrophy.
Intervertebral disc ossification [Figure 11]: It is seen in various conditions including degenerative, metabolic, crystal, and chronic inflammatory arthropathies, however, very dense central (nucleus pulposus) calcification associated with osteopenia is noted in ochronosis where calcification begins in the lumbar spine and ascends.
Flowing osteophytes, ligamentum flavum, and posterior longitudinal ligament thickening or ossification [Figure 11]: These findings along with generalized osteosclerosis suggest fluorosis. Ligamentous ossification and enthesopathy are also a common manifestation of diffuse idiopathic skeletal hyperostosis, although bone density would be normal in this condition.
Vertebral expansion, thickening of cortices, and coarsened trabecular pattern [Figure 11]: Excessive abnormal bone remodeling in the form of thickened cortex and trabeculae and bone expansion seen in Paget’s disease.
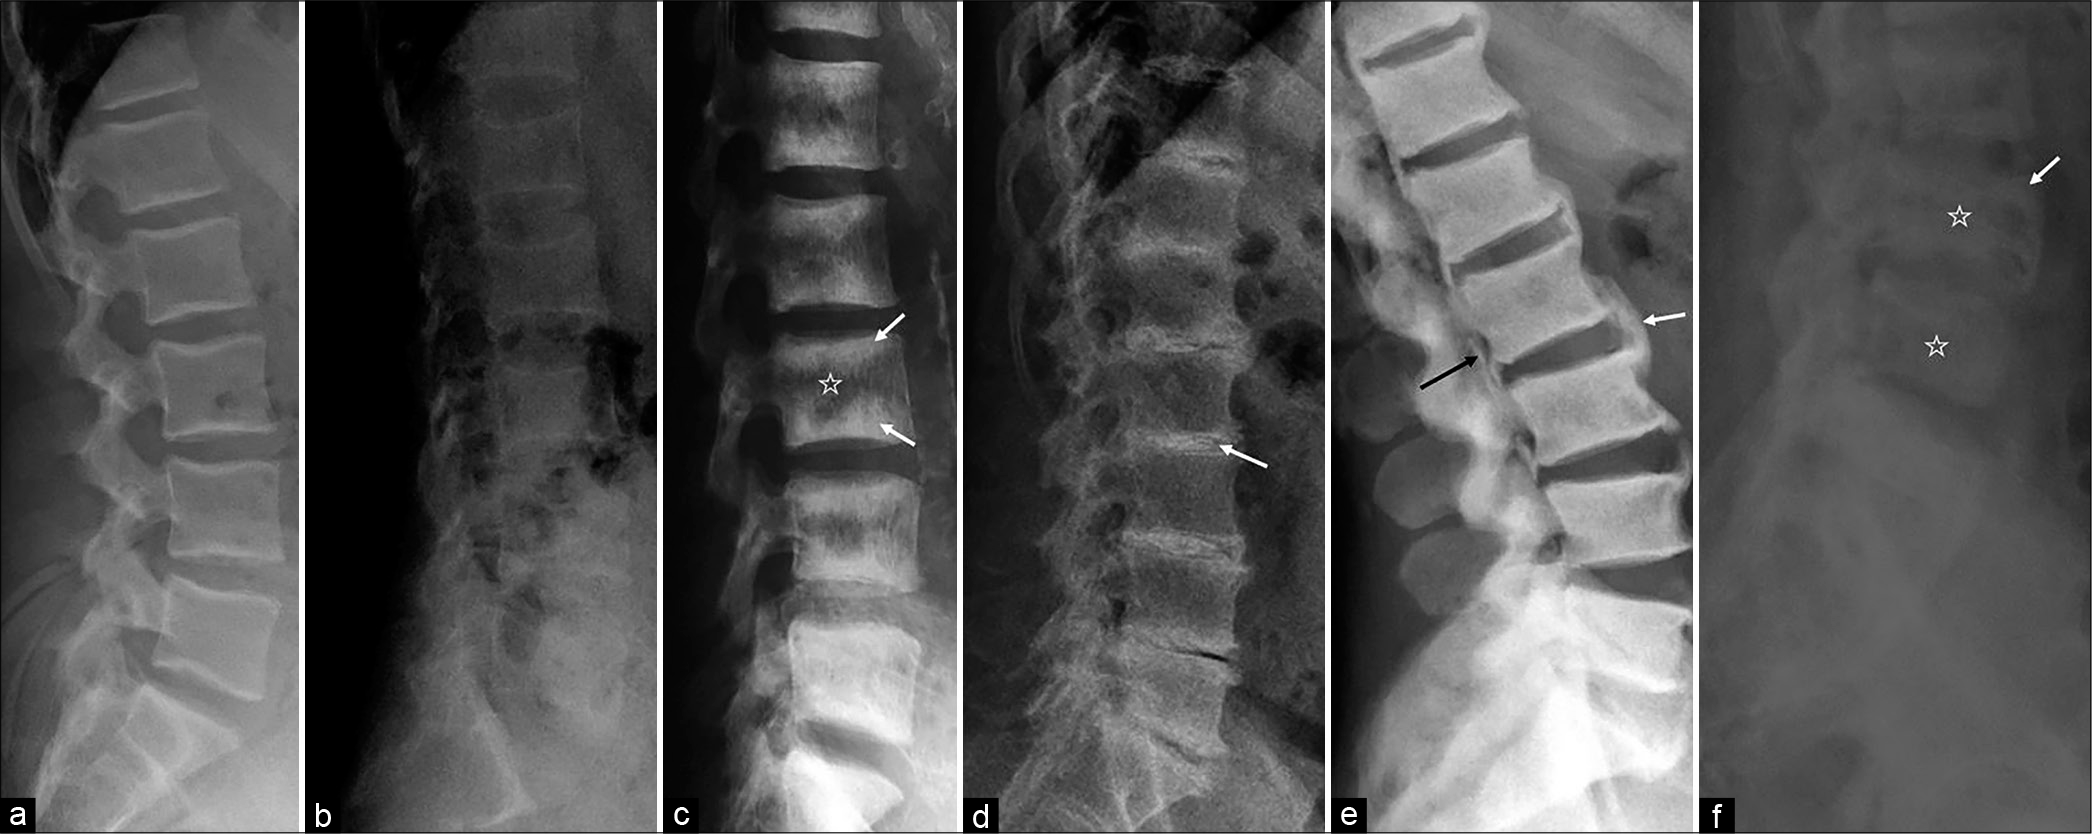
- (a) Normal lateral lumbar spine radiograph in a 36-year-old male for comparison. (b) A 37-year-old female with primary hyperparathyroidism: Lateral spine radiograph demonstrates diffuse osteopenia with cortical thinning, decreased height, and biconcavity of lumbar vertebrae suggests bone softening, findings are well appreciated when compared with normal radiograph of same age. (c) A 48-year- old female with end-stage renal disease: Lateral lumbar spine radiograph demonstrates alternating bands of sclerosis along the endplates (arrows) and areas of lucency centrally (star) suggest “Rugger-Jersey spine” seen in renal osteodystrophy. (d) A 49-year-old male with ochronosis: Lateral spine radiograph shows severe osteoporosis, multilevel disc space narrowing, and disc calcification (arrow) (involves nucleus pulposus) and osteophyte formation. (e) A 42-year-old male with fluorosis: Lateral spine radiograph depicts generalized osteosclerosis, anterior (white arrow) and posterior bridging osteophytes, and ossification of the posterior longitudinal ligament (black arrow). Calcification or ossification of the sacrotuberous ligament is considered a characteristic feature. (f) A 47-year-old male with polyostotic Paget’s disease: Lateral lumbar spine radiograph shows multilevel enlarged vertebral bodies with thickened cortex (arrow) and trabeculae (star).
ADDITIONAL RADIOGRAPHS
IV. Approach to hand radiograph: Frontal radiograph of the hand should be checked for the following checklist:
Subperiosteal resorption and acro-osteolysis [Figure 12]: Subperiosteal bone resorption is a pathognomonic finding in hyperparathyroidism and generally begins at the radial aspects of the middle phalanges of the middle and index fingers as lacelike irregularity and the distal phalangeal tufts as acro-osteolysis. It can also be seen along the metacarpals and distal radius and ulna.
Metaphyseal widening, cupping, and fraying [Figure 12]: Lack of normal mineralization is most noticeable at metaphyseal zones of provisional calcification in the growing skeleton, where there is an excess of non-mineralized osteoid resulting in growth plate widening and characteristic metaphyseal changes seen in rickets.
Bony and soft-tissue hypertrophy [Figure 12]: Bony and soft-tissue hypertrophy can be seen in acromegaly and osteopetrosis. Radiological features, including soft- tissue hyperplasia, minimally increased joint spacing due to articular cartilage overgrowth, hypertrophy of terminal phalangeal tuft, and metacarpal osteophytes on the radial aspect (metacarpal hooks) without significant increase or decrease in bone density, are seen in acromegaly. While in osteopetrosis, bony and soft-tissue hypertrophy on the background of homogeneously increased bone density with loss of after corticomedullary differentiation - are the characteristics findings. Multiple striations producing a bone within a bone appearance may be seen.
Insufficiency fracture [Figure 12]: Small tubular bones of the hand are not the usual site of insufficiency fracture. However, any subtle lucent or sclerotic line, suggesting insufficiency fracture, should be excluded in the presence of generalized osteopenia.
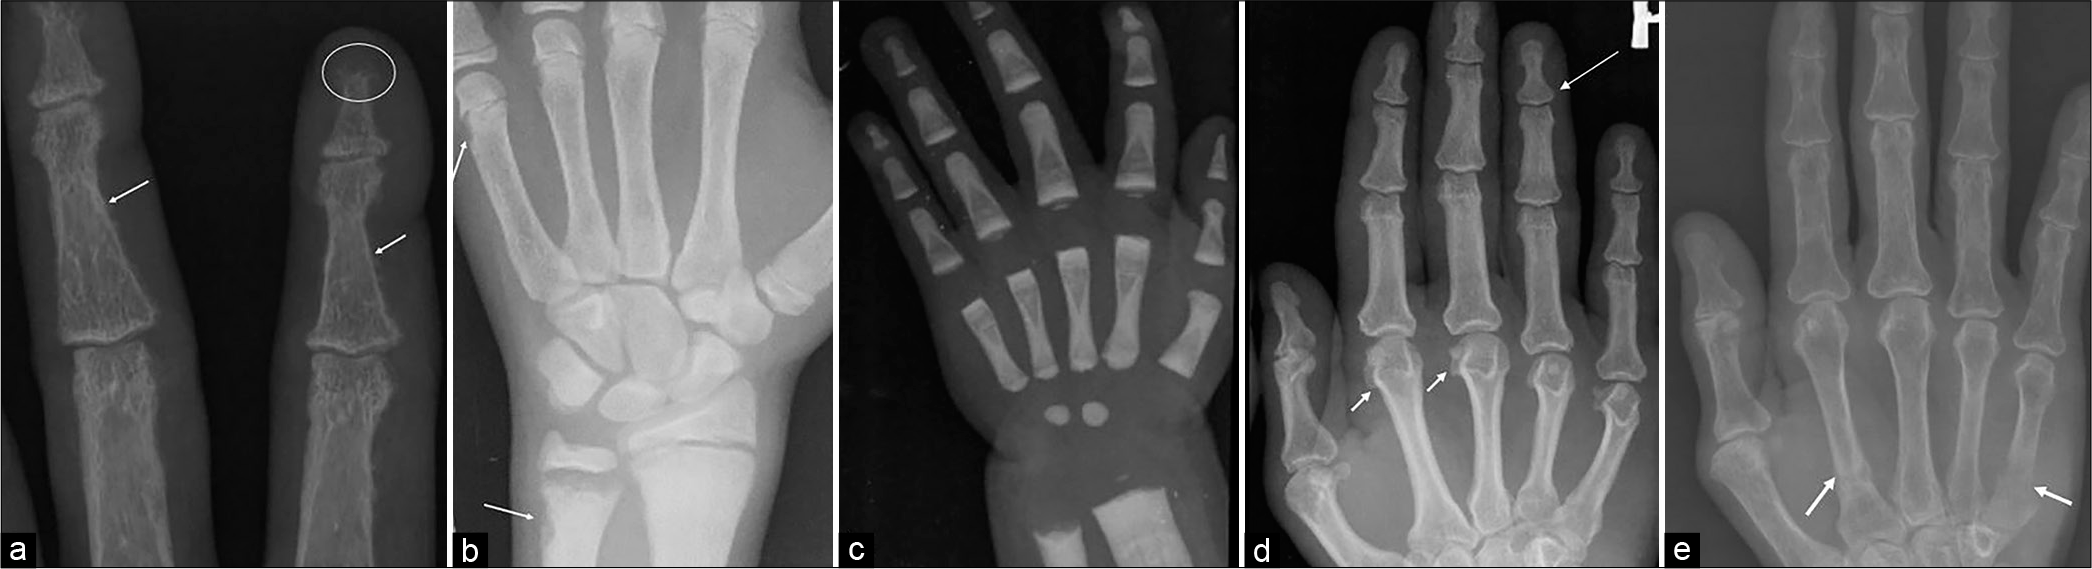
- (a) A 35-year-old female with primary hyperparathyroidism: Magnified frontal radiograph of the index and third fingers shows resorption of the distal phalangeal tufts (circle), suggests acro-osteolysis; subperiosteal resorption is depicted along the radial aspects of the proximal and middle phalanges (arrows) on the background of marked osteopenia. (b) A 15-year-old male with renal rickets and secondary hyperparathyroidism: Frontal hand radiograph shows widened physis with indistinct margin, widening, and concavity of distal ulnar metaphysis characteristic for rickets; subperiosteal resorption at the medial margin of distal ulna and distal metacarpals (arrows) on the background of osteosclerosis is a clue for secondary hyperparathyroidism. (c) A 2-year-old male with osteopetrosis: Frontal radiograph depicts uniformly increased bone density with obliteration of medullary cavity; multiple alternating dense and radiolucent transverse lines in the bones of wrist and hand. (d) A 41-year-old male with acromegaly: Frontal hand radiograph shows mild widening of base of terminal phalanx (long arrow); prominent osteophyte on the radial aspect of metacarpal head (short arrows); and mild diffuse soft-tissue enlargement. (e) A 62-year-old female with tumor-induced osteomalacia: Frontal hand radiograph shows diffuse osteopenia with insufficiency fractures of the proximal shaft of the 2nd and 5th metacarpals (arrows).
V. Approach to knee radiograph: Frontal and lateral radiographs of the knee should be assessed for the following checklist:
Physeal and metaphyseal widening and fraying [Figure 13]: Physeal widening and metaphyseal splaying, cupping, and fraying with generalized osteopenia suggest rickets.
Insufficiency fracture [Figure 13]: Insufficiency fractures appear as linear radiolucent bands perpendicular to the long axis of the bone and are classically at the concave side of a bowing deformity.
Subperiosteal resorption [Figure 13]: In the presence of osteopenia, the cortices should be evaluated for subperiosteal or intracortical resorption. It is classically seen along the medial aspect of the proximal tibia.
Focal lesion [Figure 13]: The imaged part of long bones should be checked for the brown tumor.
Enthesopathic changes [Figure 13]: It is seen in X-linked hypophosphatemic osteomalacia and primary hypoparathyroidism. Dense metaphyseal bands and focal or diffuse increase in bone density are noted in hypoparathyroidism.

- (a) A 10-year-old girl with rickets: Frontal radiograph of bilateral knee demonstrating classic metaphyseal splaying, cupping, fraying (long arrow), and physeal widening around the knee (short arrow) with generalized osteopenia. (b) A 35-year-old male with primary hyperparathyroidism. The frontal radiograph of the knee shows subperiosteal resorption along the medial proximal tibia (circle); a tiny subchondral insufficiency fracture of the medial femoral condyle (black arrow) and a subtle lytic lesion within the lateral tibial plateau and adjacent metaphysis (white arrows) suggest a brown tumor. (c) A 46-year-old male with primary hypoparathyroidism: Lateral knee radiograph shows multifocal enthesopathic changes (arrows) with a mild diffuse increase in the bone density.
VI. Approach to lateral skull radiograph: Lateral radiograph of the skull should be checked for the following checklist:
Skull vault [Figure 14]: Inner and outer tables of calvarium should be evaluated for thinning and thickening, and widening of diploic space. Thickening of skull vault seen in Paget’s disease, acromegaly, osteopetrosis, and hypoparathyroidism while thinning is a dominant feature of osteogenesis imperfecta, hypophosphatasia, and hyperparathyroidism. Frontal bone can be thickened or enlarged in acromegaly and Paget’s disease and the overriding enlarged frontal bone giving a “Tam O’Shanter” sign is seen in Paget’s disease of the skull.
Focal lesion [Figure 14]: Multifocal tiny mixed lucent and sclerotic foci are features of hyperparathyroidism (“Pepper pot skull”) and Paget’s disease (“cotton wool appearance”). Large well-defined lytic areas within the skull affecting inner and more remarkably outer calvarial tables, seen in the lytic phase of Paget’s disease, which is commonly known as “osteoporosis circumscripta.”
Loss of lamina dura [Figure 14]: Subperiosteal resorption along the teeth resulting in loss of lamina dura. d) Sutural diastasis [Figure 14]: An abnormal widening of the skull sutures seen in hypoparathyroidism, rickets, or hypophosphatasia.
Wormian bones [Figure 14]: Multiple ossification centers (Wormian bones) are seen within the sutures in osteogenesis imperfecta.
Enlarged sella and paranasal sinuses [Figure 14]: These findings are characteristically seen in acromegaly. Associated widened mandibular angle, occipital protuberance overgrowth, and malocclusion can be seen.
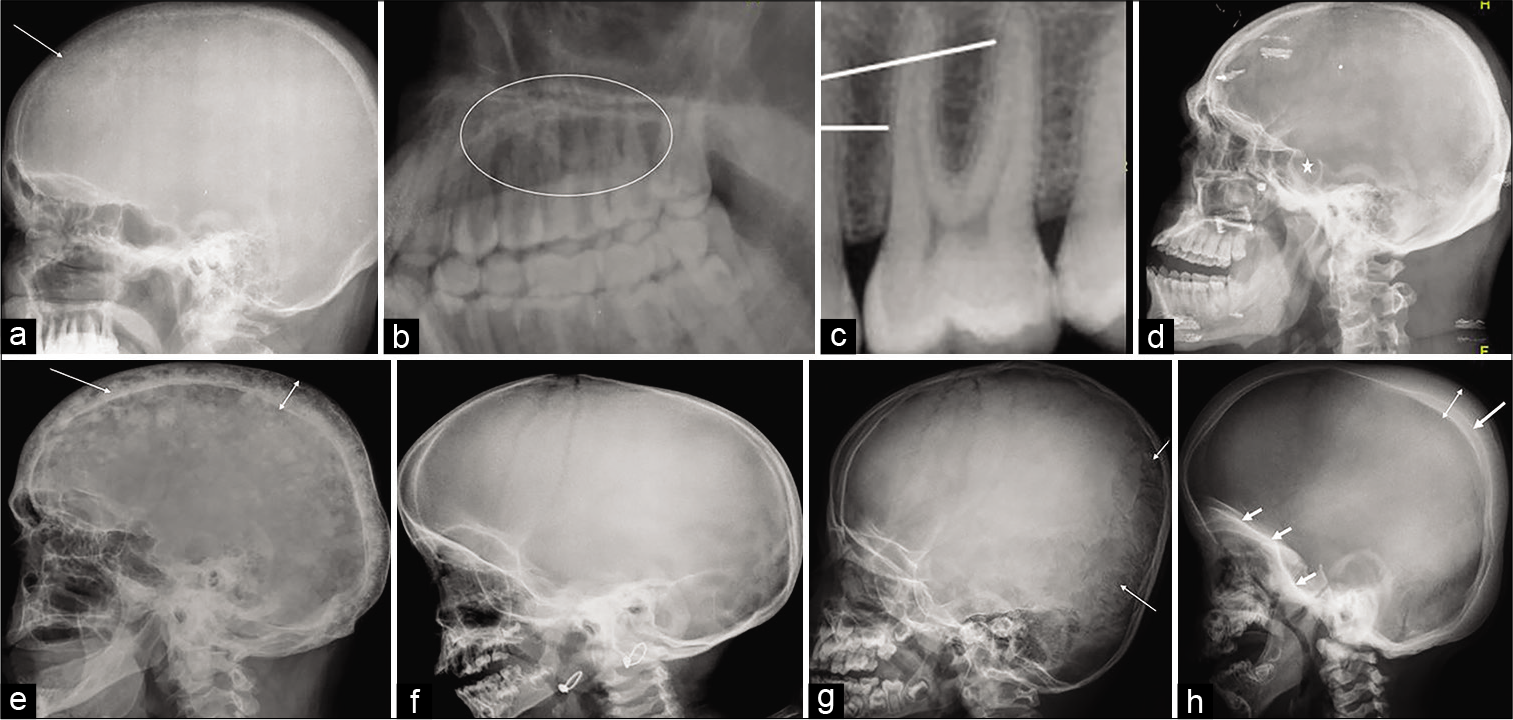
- (a-b) A 40-year-old male with primary hyperparathyroidism: Lateral skull radiograph shows loss of definition of the inner table of the skull (arrow) with multiple punctate lucent and radiodense foci seen throughout the skull due to trabecular resorption, giving a “salt- and-pepper” appearance. Magnified image of upper jaw shows loss of lamina dura (circle) which is normally seen as radiopaque line (lines) surrounding the root of the tooth, as shown in image (c). (d) A 41-year-old male with acromegaly: Lateral skull radiograph reveals enlarged sella (star) with double flooring, thickened skull vault, enlarged paranasal sinuses, and prognathism. (e) A 63-year-old male with Paget’s disease: Lateral radiograph of the skull shows widening of the diploic space (double headed arrow) with thickened outer and more extensively inner (long arrow) tables; innumerable mixed lytic and sclerotic foci within the skull giving a typical “cotton wool” appearance. (f) A 26-month- old female with rickets: Lateral skull radiograph shows thinning of the calvarium; abnormal widening of skull sutures and fontanelles. (g) A 6-month-old male with osteogenesis imperfecta: Lateral skull radiograph demonstrates thinning of the skull with multiple wormian bones are noted predominantly in the occipital region within the lambdoid suture (arrows). (h) A 4-year-old male with osteopetrosis: Lateral skull radiograph reveals calvarial (double headed arrow) and basilar skull thickening (short arrows) and sclerosis, the inner table is more thickened and radiodense (long arrow) as compared to the outer table; poorly developed sinuses and mastoid process with defective dentition.
DISCUSSION
The metabolic bone disorders are a broad spectrum of heterogeneous conditions of inherited, acquired, and nutritional disorders that affect the bone mass and structure, resulting in either decreased or increased bone density or abnormal mineralization of the bone.[17,29] The common metabolic bone diseases include osteoporosis, rickets or osteomalacia, and primary hyperparathyroidism.[1,17] The clinical presentation is very non-specific, and often, the diagnosis is missed if plain radiography has not been done or evaluated for subtle findings that can clinch the diagnosis. MRI is increasingly used as the initial modality for evaluation because of these non-specific complaints. Although MR imaging contributes significantly to exclude the marrow infiltrative or degenerative or infective or inflammatory conditions, the plain radiographs are the most valuable imaging tool in diagnosing the metabolic bone conditions.
In real life, there is no clinical suspicion of metabolic bone diseases in the majority of cases. When these patients undergo MRI, often the non-specific findings, for example, bone marrow signal changes of stress edema with or without occult trabecular fracture within the iliac or sacral bones on SI joint MRI can be mistaken for active sacroiliitis of spondyloarthropathy. Similarly, subchondral bone resorption along the iliac side of the SI joint resembles inflammatory sacroiliitis and might lead to misdiagnosis. Therefore, a plain radiograph is a panacea for the diagnosis of bone conditions.
THE KEY TEACHING POINTS
We should always look at the plain radiographs while reporting cross-sectional imaging such as MRI and CT even when there is no clinical indication of metabolic bone disease. If the plain radiographs are not available, we should always ask it before concluding the final diagnosis on cross-sectional imaging.
In cases of inconclusive diagnosis on MRI, the utility of plain radiographs, serum markers, and discussion with treating physicians may help in arriving at an accurate diagnosis and guiding the clinicians for further investigations and management.
CONCLUSION
The plain radiography remains as an indispensable imaging modality in the evaluation of the metabolic bone diseases despite several imaging advances. The imaging manifestations of the diverse metabolic bone diseases are varied with a wide range of skeletal findings. Therefore, comprehensive knowledge of relevant radiological findings is necessary for early diagnosis, to aid appropriate management and the prevention of further progression of the disease process.
Declaration of patient consent
Patient’s consent not required as there are no patients in this study.
Financial support and sponsorship
Nil.
Conflicts of interest
There are no conflicts of interest.
References
- Radiology of metabolic bone disease. Endocrinol Metab Clin North Am. 1989;18:955-76.
- [CrossRef] [Google Scholar]
- Utility of plain radiographs in metabolic bone disease-a case-based pictorial review from a tertiary centre. Pol J Radiol. 2017;82:333-44.
- [CrossRef] [PubMed] [Google Scholar]
- Anteroposterior and lateral radiographs: An adequate lumbar spine examination. AJR Am J Roentgenol. 1981;136:715-7.
- [CrossRef] [PubMed] [Google Scholar]
- Precise identification of radiographic acetabular landmarks. Clin Orthop Relat Res. 1979;141:166-8.
- [CrossRef] [Google Scholar]
- A radiographic survey of normal joints: The wrist joint and hand. Br J Radiol. 1927;32:199.
- [CrossRef] [Google Scholar]
- Radiographic techniques, contrast, and noise in x-ray imaging. AJR Am J Roentgenol. 2015;204:W126-31.
- [CrossRef] [PubMed] [Google Scholar]
- Textbook of Radiology and Imaging (7th edition). London: Churchill Livingstone; 2003.
- [Google Scholar]
- Radiology of osteoporosis. Radiol Clin North Am. 2010;48:497-518.
- [CrossRef] [PubMed] [Google Scholar]
- Skeletal renewal and metabolic bone disease. N Engl J Med. 1969;280:193-202.
- [CrossRef] [PubMed] [Google Scholar]
- Essentials of Skeletal Radiology (3rd ed). Baltimore, MD, USA: Lippincott Williams & Wilkins; 2004.
- [Google Scholar]
- Imaging of metabolic bone diseases. Radiol Clin North Am. 2008;46:735-54, 6
- [CrossRef] [PubMed] [Google Scholar]
- Diagnosis and management of involutional osteoporosis. Can Fam Physician. 1979;25:467-72.
- [Google Scholar]
- Advances in bone imaging for osteoporosis. Nat Rev Endocrinol. 2013;9:28-42.
- [CrossRef] [PubMed] [Google Scholar]
- Integrated imaging approach to osteoporosis: State-of-the-art review and update. Radiographics. 2011;31:1343-64.
- [CrossRef] [PubMed] [Google Scholar]
- Imaging findings of metabolic bone disease. Radiographics. 2016;36:1871-87.
- [CrossRef] [PubMed] [Google Scholar]
- Imaging findings and evaluation of metabolic bone disease. Adv Radiol. 2015;2015:21.
- [CrossRef] [Google Scholar]
- Alcoholism-associated spinal and femoral bone loss in abstinent male alcoholics, as measured by dual X-ray absorptiometry. Skeletal Radiol. 1992;21:431-6.
- [CrossRef] [PubMed] [Google Scholar]
- Factors associated with 5-year risk of hip fracture in postmenopausal women. JAMA. 2007;298:2389-98.
- [CrossRef] [PubMed] [Google Scholar]
- Metabolic and endocrine diseases of the skeleton In: Grainger RG, Allison D, Adam A, Dixon AK, eds. Diagnostic Radiology: A Textbook of Medical Imaging (4th ed). London, England: Churchill Livingstone; 2001. p. :1960-1.
- [Google Scholar]
- Parathyroid disorders and renal osteodystrophy In: Diagnosis of Bone and Joint Disorders. Philadelphia, PA, USA: WB Saunders; 1995.
- [Google Scholar]
- Musculoskeletal manifestations of osteomalacia and rickets. Best Pract Res Clin Rheumatol. 2003;17:1063-80.
- [CrossRef] [PubMed] [Google Scholar]
- Pelvic ramus fractures in the elderly: 50 patients studied with MRI. Acta Orthop. 2005;76:513-6.
- [CrossRef] [PubMed] [Google Scholar]
- Radiologic diagnosis of metabolic bone disease. Orthop Clin North Am. 1972;3:521-43.
- [Google Scholar]


